
Fig. 6.
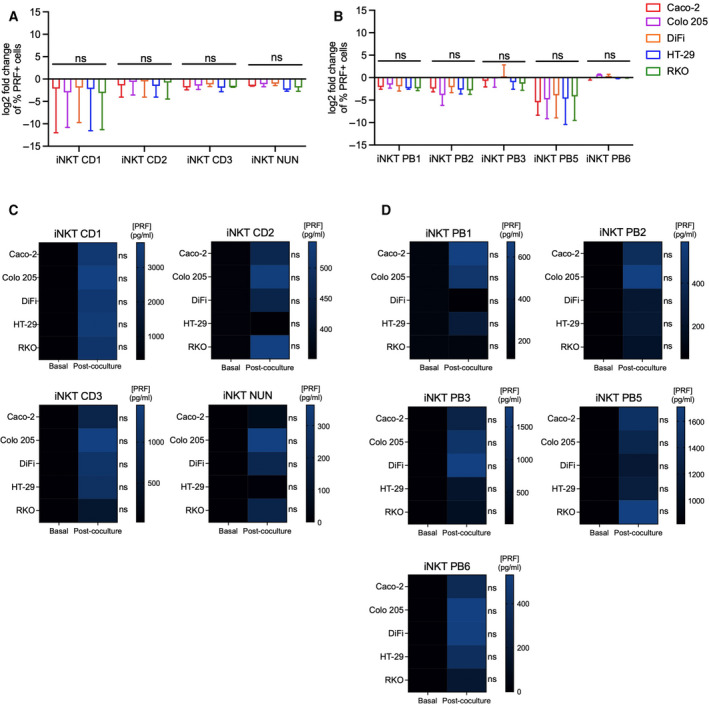
iNKT cell lines release perforin upon CRC cell encounter. (A–B) Frequencies of perforin (PRF)‐positive intestinal (A) and circulating (B) iNKT cells before and after 4‐h coincubation. (C–D) Perforin concentration in iNKT cell supernatants at 8 : 1 E : T ratio alone vs after incubation with colon cancer cells for intestinal (C) and peripheral blood (D) iNKT cells. Kruskal–Wallis test was used to assess statistical significance, and Dunn’s test was used for multiple comparisons. ns. nonsignificant, P‐value < 0.05 (*), 0.01 (**), 0.001 (***), 0.0001 (****). Data are means ± SD for B–C and means for D–E of 3 independent experiments.