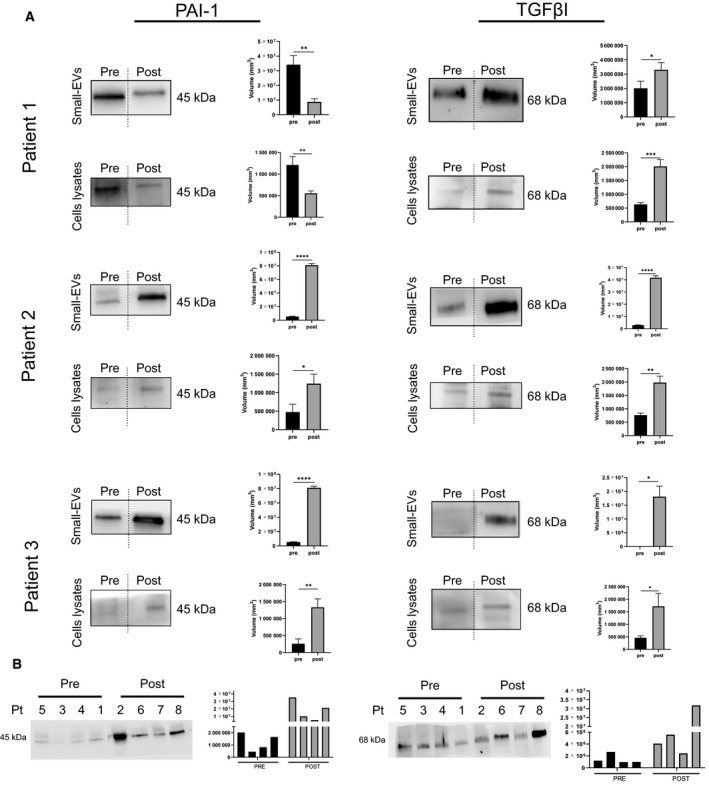
Fig. 7.

Differential TGFβI and PAI‐1 expression in small‐EV samples taken before and after chemotherapy. (A) Protein extracts (30 µg) prepared from small‐EVs isolated from bulk fluid ascites, small‐EVs isolated from ascites tumor cell cultures, and ascites tumor cell lysates of patients 1, 2, and 3 were loaded on a 4–12% SDS/PAGE followed by western blot using antibodies against TGFβI and PAI‐1. Two‐tailed t‐tests were used for protein expression analysis. Data are reported as means ± SD of one experiment performed in triplicate. *P < 0.05, **P < 0.01, ***P < 0.001, ****P < 0.0001. (B) Analysis of the small‐EVs isolated from ascites tumor cell cultures on the cohort of patients divided into two groups: the patients who did not receive chemotherapy at the time of sampling and the patients who underwent chemotherapy. The patient’s number corresponds to Table 1.
