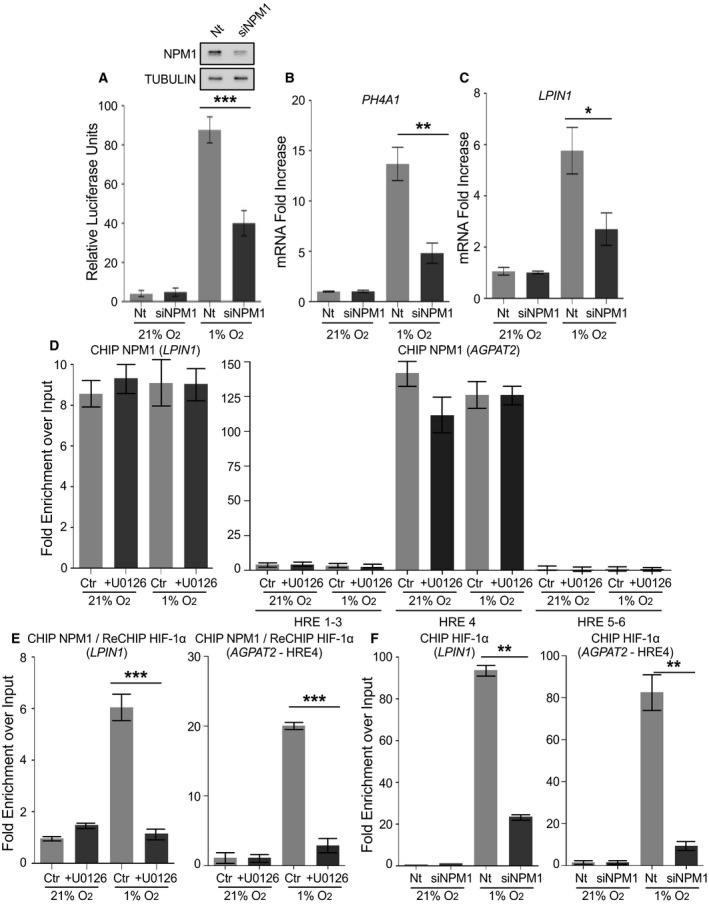
Fig. 3.

NPM1 is essential for HIF‐1 transcriptional activity and stable binding to HRE. (A) Transcriptional activity of HIF‐1 in HeLa cells, cotransfected with control (Nt) or NPM1 siRNA (siNPM1) and the pGL3–5HRE‐VEGF and pCI‐Renilla reporter plasmids and grown at 21% or 1% O2 for 16 h. Values were determined as ratio of firefly luciferase activity over renilla activity and represent the mean of two independent experiments performed in quadruplets ± SEM (***P < 0.001). Immunoblots shown as inset demonstrate NPM1 levels without (Nt) or after NPM1 silencing (siNPM1). Tubulin was used as loading control. (B, C) mRNA levels of HIF‐1 target genes P4HA1‐1 (B) or LPIN1 (C) as determined by RT‐PCR in HeLa cells treated with control (Nt) or NPM1 siRNA (siNPM1) and grown at 21% or 1% O2 for 16 h. Results are shown as fold increase in relation to respective normoxic conditions and represent the mean of two independent experiments performed in triplicates ± SD (n = 6; *P < 0.05, **P < 0.01). (D, E) RT‐PCR analysis of sequential chromatin immunoprecipitation (ChIP‐re‐ChIP) using first anti‐NPM1 (ChIP; D) and then anti‐HIF‐1α antibodies (re‐ChIP; E) from Huh7 cells grown at 21% or 1% O2 for 24 h with or without 10 μm U0126 (as indicated). Left panels in (D) and (E) show analysis using primers for the area of the LPIN1 promoter containing a known HIF‐1 binding site (for details see also Fig. S6B). Right panels in (D) and (E) show analysis using primers for the areas of the AGPAT2 promoter containing a known HIF‐1 binding site (HRE4) or nonfunctional HRE‐like sequences (HRE1–3, HRE5–6; for details see also Fig. S6B). (F) RT‐PCR analysis of ChIP with anti‐HIF‐1α antibodies from Huh7 cells treated with control (Nt) or NPM1 siRNA (siNPM1) for 24 h and incubated at 21% or 1% O2 for 8 h. Left panel: analysis using primers for the HIF‐1 binding site in the LPIN1 promoter. Right panel: analysis using primers for the HIF‐1 binding site (HRE4) in the AGPAT2 promoter. Results represent the mean of two independent experiments analyzed in triplicates ± SD (unpaired t‐test; *P < 0.05; **P < 0.01; ***P < 0.001).
