
Fig. 4.
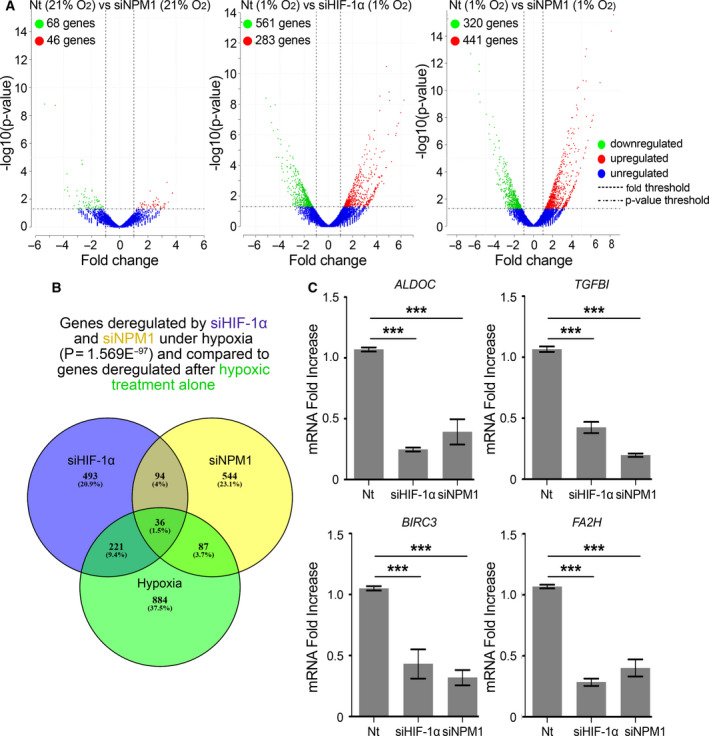
HIF‐1α and NPM1 coregulate a significant number of genes under hypoxia. HeLa cells treated with control (Nt) or NPM1 siRNA (siNPM1) for 24 h and incubated at 21% or 1% O2 for 24 h were then processed for 3′ mRNA sequencing. Values represent the mean of two independent experiments. (A) Volcano plots of genes showing significantly different expression levels after NPM1 (siNPM1) or HIF‐1α (siHIF‐1α) silencing compared to control (Nt) in cells under normoxia (21% O2) or hypoxia (1% O2). Normalized enrichment score from Gene Set Enrichment Analysis is shown. Statistical analysis was performed with DESeq through the Bioconductor package metaseqR [21]; P‐value < 0.05. (B) Venn diagram representing the number of genes significantly deregulated after HIF‐1α (Magenta) or NPM1 (Yellow) silencing under hypoxia in comparison to genes deregulated after hypoxic treatment alone (Green). (C) ALDOC, TGFBI, BIRC3, and FA2H expression levels were determined by RT‐PCR as indicated. Results are shown as fold decrease in relation to the respective control conditions (Nt) and represent the mean of two independent experiments performed in quadruplet ± SD (n = 8; ***P < 0.001; Statistical variance between two groups of values was calculated by two‐tailed Student's t‐test).