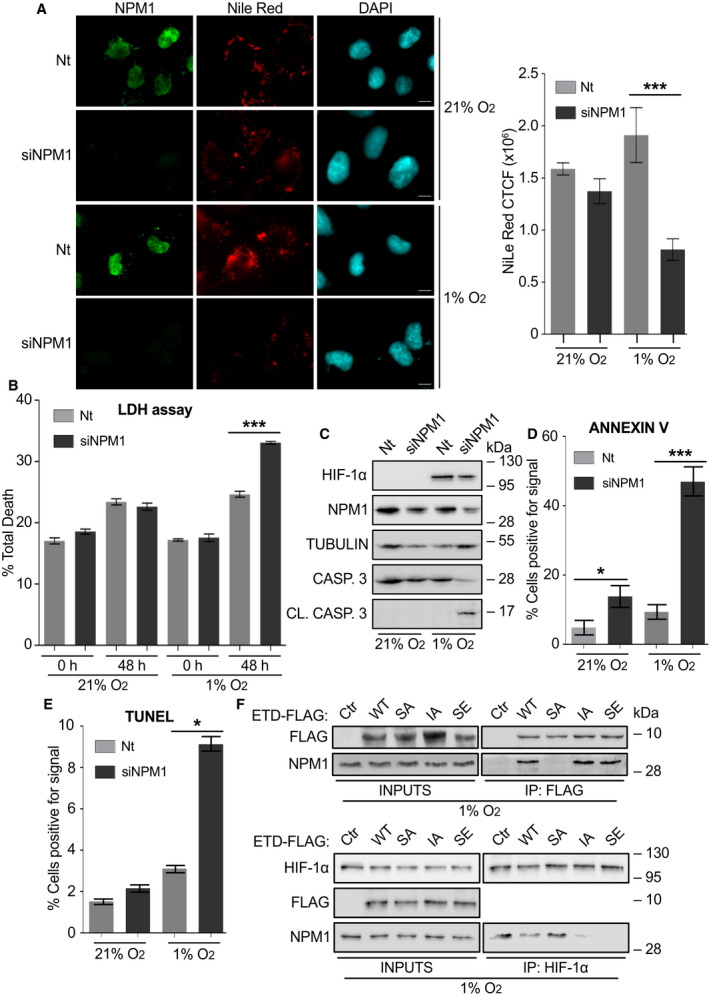
Fig. 5.

The NPM1/HIF‐1α interaction is essential for HIF‐1‐mediated metabolic adaptation and survival of cancer cell under hypoxia. (A) Left: Immunofluorescence microscopy images of HeLa cells treated with control (Nt) or NPM1 siRNA (siNPM1) for 24 h, incubated at 21% or 1% O2 for 24 h and then processed for detection of NPM1 (green) and lipid droplets (red). Nuclei are stained with DAPI (cyan; Scale bars: 10 μm). Right: Graph analysis of Nile Red fluorescent signal quantified with ImageJ software. Values represent corrected total cell fluorescence (CTCF) and are mean ± SEM of measurements of 35 individual cells per condition (Statistical variance between two groups of values was calculated by two‐tailed Student's t‐test, ***P < 0.001). (B) Cell death analysis in HeLa cells transfected with control (Nt) or NPM1 siRNA (siNPM1) and, 24 h post‐transfection, incubated at 21% or 1% O2 for 48 h. Results are the mean of two independent experiments performed in quadruplets ± SEM (Statistical variance between two groups of values was calculated by two‐tailed Student's t‐test, ***P < 0.001). (C) Immunoblotting analysis of lysates of HeLa cells transfected with control (Nt) or NPM1 siRNA (siNPM1) and incubated at 21% or 1% O2 for 24 h using antibodies against HIF‐1α, NPM1, tubulin, uncleaved (inactive) caspase 3 and cleaved (active) caspase 3 as indicated. Certain panels show single blot areas that correspond to the indicated molecular weight marker and were cut after blotting for analysis with different antibodies. (D) Quantification of Annexin V staining as detected by fluorescence microscopy of HeLa cells treated as in (C). Values are given as % ratio of Annexin V‐positive cells in relation to the total number of cells per condition ± SEM (n = 150 cells; Statistical variance between two groups of values was calculated by two‐tailed Student's t‐test, *P < 0.05; ***P < 0.001). (E) Quantification of TUNEL fluorescent signal in HeLa cells treated as in (C). Values are given as % ratio of fluorescence positive cells in relation to the total number cells ± SEM (n = 250 cells; Statistical variance between two groups of values was calculated by two‐tailed Student's t‐test, *P < 0.05). (F) Immunoblotting of soluble extracts (INPUTS) and anti‐FLAG (upper panels) or anti‐HIF‐1α (lower panels) IP of Huh7 cells grown at 1% O2 and treated with ˜380 nm of the indicated TAT‐ETD‐FLAG forms for 5 h, using antibodies against Flag, HIF‐1α, and NPM1 as indicated. Panels show single blot areas that correspond to the indicated molecular weight marker and were cut after blotting for analysis with different antibodies; images are representative of two independent experiments.
