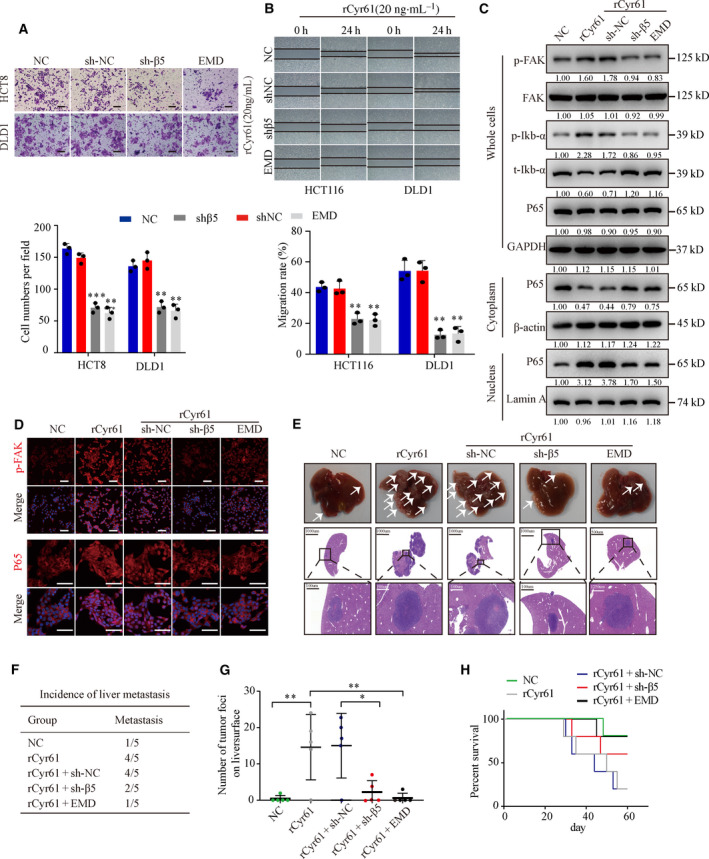
Fig. 4.

Cyr61 promotes CRC cell migration and invasion via αVβ5/FAK/NF‐κB signaling pathway. (A) Representative images of transwell migration assays for HCT8 and DLD1 cells with integrin β5 knockdown or treated with integrin αVβ5 inhibitor EMD 121974 (EMD) before treated with rCyr61 (20 ng·mL−1). Scale bar = 100 μm, n = 3. (B) Representative images of wound‐healing assays for HCT116 and DLD1 cells with integrin β5 knockdown or treated with integrin αVβ5 inhibitor EMD before treated with rCyr61 (20 ng·mL−1). n = 3. (C) Western blot analysis the expression of p‐FAK, FAK, p‐Ikb‐α, t‐Ikb‐αP65, and P65 in HCT8 cells with integrin β5 knockdown or with integrin αVβ5 inhibitor EMD. GAPDH, β‐actin, and Lamin A were used as the controls. (D) Confocal microscopy assays were performed to detect the expression of p‐FAK and subcellular localization of P65 in HCT8 cells with integrin β5 knockdown or treated with integrin αVβ5 inhibitor EMD. Scale bar = 50 μm. (E) Autopsy and H&E staining of the livers in the nude mice by in vivo liver metastasis assays (n = 5 per group). The arrows indicated the liver metastasis. Black scale bar = 1000 μm. White scale bar = 100 μm. (F) Incidence of liver metastasis in the nude mice in vivo liver metastasis assays. (G) Number of tumor foci on liver surface in the nude mice in vivo liver metastasis assays. (H) Kaplan–Meier survival analysis of the nude mice. NC, negative control. Values are represented as mean ± SD. *P < 0.05, **P < 0.01, ***P < 0.001, by two‐tailed Student's t‐test and one‐way ANOVA (A, B, G).
