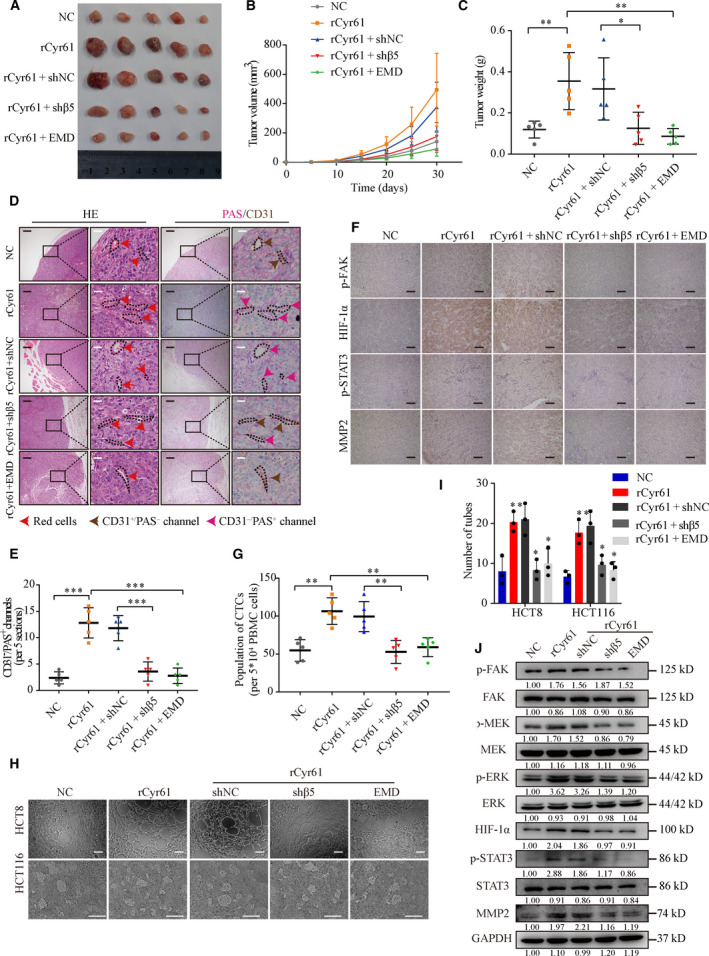
Fig. 5.

Cyr61 promotes VM formation to promote CRC progression via integrin αVβ5. (A) Tumors in nude mice subcutaneously injected with HCT8 cells pretreated with rCyr61, EMD, or knockdown integrin β5 expression (n = 5 per group). (B) Growth curves of the xenograft tumors. (C) Tumor weight of the HCT8 xenograft tumors. (D) H&E, PAS, and CD31 staining in xenograft tumors. Red arrows indicate the presence of red blood cells; brown arrows indicate typical blood vessels with CD31+ staining; pink arrows indicate PAS+/CD31− VM channels. Black scale bars = 200 μm, white scale bars = 20 μm. (E) The numbers of PAS+/CD31− VM channels in xenograft tumors. (F) IHC analysis of p‐FAK, HIF‐1α, p‐STAT3, and MMP2 expression in xenograft tumors. Scale bars = 100 μm. (G) Statistics of the flow cytometric analysis of the GFP labeled CTCs from whole blood in the nude mice. (H, I) Representative images and statistics of tube formation in HCT8 and HCT116 cells pretreated with rCyr61, EMD, or knockdown integrinβ5 expression. Scale bars = 100 μm, n = 3. (J) Western blot analysis of αVβ5/FAK/HIF‐1α/STAT3/MMP2 signaling cascade in HCT8 cells pretreated with rCyr61, EMD, or knockdown integrin β5 expression. NC, negative control. Values are represented as mean ± SD. *P < 0.05, **P < 0.01, ***P < 0.001, by 2‐tailed Student’s t‐test and one‐way ANOVA (C, E, G, I).
