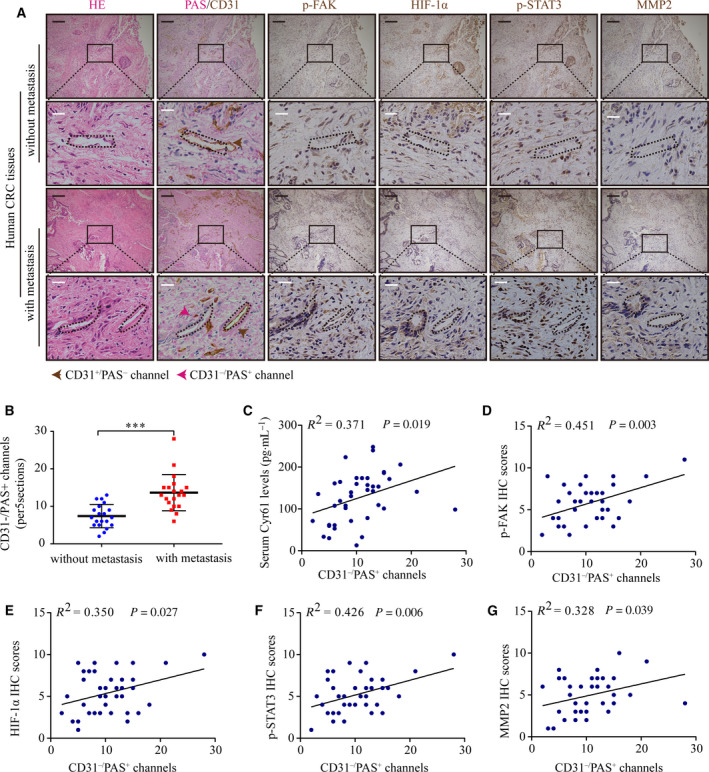
Fig. 6.

The relationship between serum Cyr61 levels and VM in CRC tissues. (A) H&E staining, VM formation, p‐FAK, HIF‐1α, p‐STAT3, and MMP2 expression in CRC patients with or without metastasis. n = 20 per group. Black scale bars = 200 μm; white scale bars = 20 μm. (B) Statistics of PAS+/CD31− VM channels in CRC patients with or without metastasis. (C–G) Pearson correlation of PAS+/CD31− VM channels with serum Cyr61 levels, p‐FAK, HIF‐1α, p‐STAT3, and MMP2 IHC scores in CRC tissues. Values are represented as mean ± SD. ***P < 0.001, by two‐tailed Student's t‐test (B).
