
Fig. 1.
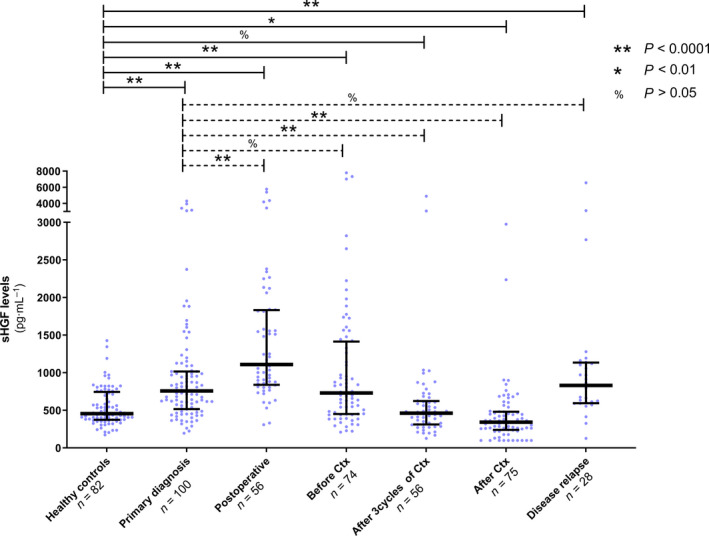
sHGF levels from primary diagnosis, surgery, and platinum‐based chemotherapy to relapse. Scatter plot showing sHGF levels in healthy controls (n = 82), in ovarian cancer patients at primary diagnosis (n = 100) and among five subsequent follow‐up samples, obtained (a) within 1 week after primary surgery (postoperative, n = 56), (b) before platinum‐based chemotherapy (before Ctx, n = 74), (c) after the third cycle of chemotherapy (n = 56), (d) after completion of chemotherapy (after Ctx, n = 75), and (e) at disease relapse (n = 28). The black horizontal lines indicate the median sHGF level in each group with error bars, showing the interquartile range. P‐values, according to the nonparametric, two‐tailed Mann–Whitney U‐test, are indicated.