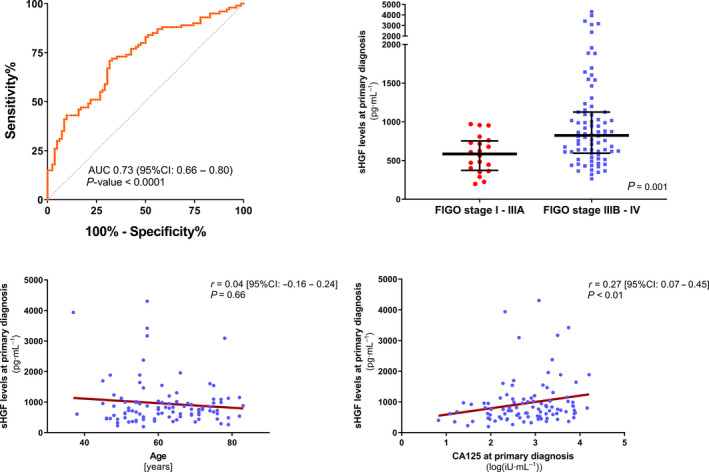
Fig. 2.

Association of sHGF level with clinicopathological parameters of ovarian cancer. (A) ROC analysis to determine the diagnostic ability of sHGF level to distinguish between patients with a primary diagnosis of ovarian cancer and healthy controls. Ovarian cancer patients, n = 100; healthy individuals, n = 82. The respective AUC value and the 95%CI are indicated. (B) Scatter plots comparing sHGF level at primary diagnosis between FIGOI‐IIIA (n = 20) vs. FIGO IIIB‐IV (n = 80) ovarian cancer patients. The black horizontal lines indicate the median sHGF level with error bars, showing the interquartile range. P‐value, according to the nonparametric, two‐tailed Mann–Whitney U‐test, is indicated. (C, D) Spearman’s correlation analysis of sHGF at primary diagnosis and (C) the patients’ age, n = 100 ovarian cancer patients; or (D) baseline CA125 log values, n = 97 ovarian cancer patients with available matching CA125 values at primary diagnosis.
