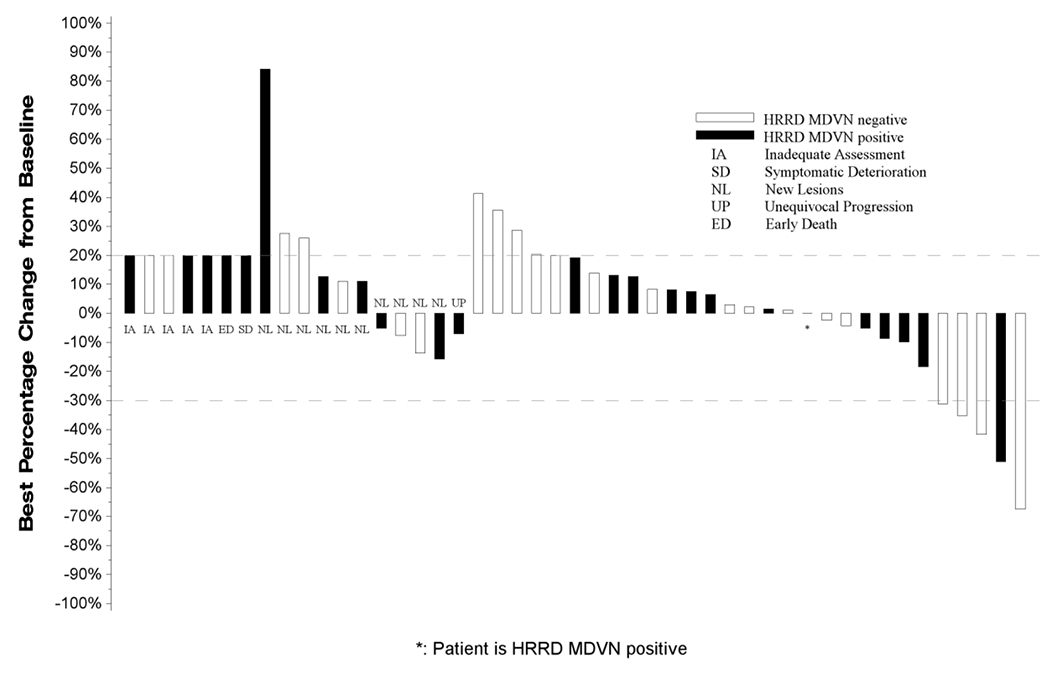
Figure 1:

Waterfall Plot with Annotations for Individual Alterations
All eligible patients who received at least one dose of Talazoparib (BMN673) are represented in this plot. From left to right, best change in tumor measurements included in the plot are displayed as;
• IA: Measurements for patients who did not have any follow-up tumor disease assessments are labeled with ‘IA’ and displayed as a 20% increase, the threshold for progressive disease.
• SD: Measurements for patients who had symptomatic deterioration at first disease assessment are labeled as “SD” and displayed as a 20% increase, the threshold for progressive disease.
• ED: Measurements for patients who expired prior to disease assessment, but the death was not due to disease are labeled as “ED” and displayed as a 20% increase, the threshold for progressive disease.
• NL: Measurements for patients who had progressive disease at their first assessment based on new lesions are labeled by “NL”. The percentage change from baseline to first disease assessment is displayed.
• UP: Measurements for patients who had unequivocal progression in non-target lesions at their first follow-up assessment are labeled as “UP”. The percentage change from baseline to first disease assessment is displayed.
• Unlabeled bars: To the right of the labeled bars are bars representing the best change in measurements for patients not coded as IA, SD, ED, NL, or UP with at least one follow-up disease assessment.
Bars extending above the dashed line at +20% or labeled as IA, SD, ED, NL, or UP are coded as progressive disease. Unlabeled bars between the dashed lines (+20% to −30%) are coded as best response of stable disease and unlabeled bars extending below the −30% line are coded as best response of partial or complete response.
