
Figure 2.
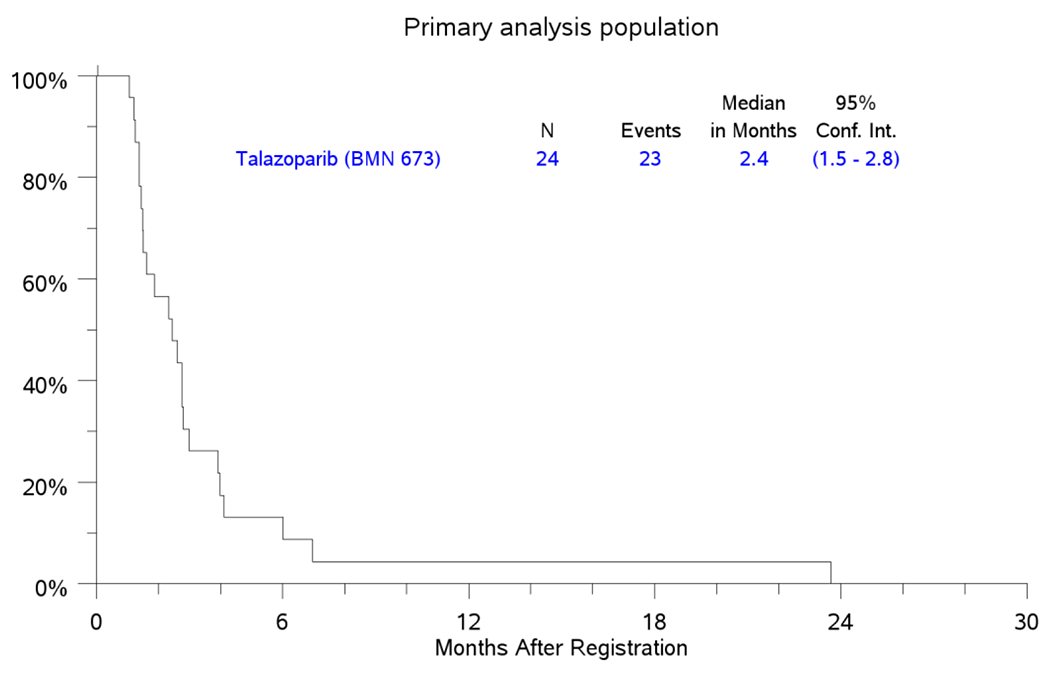
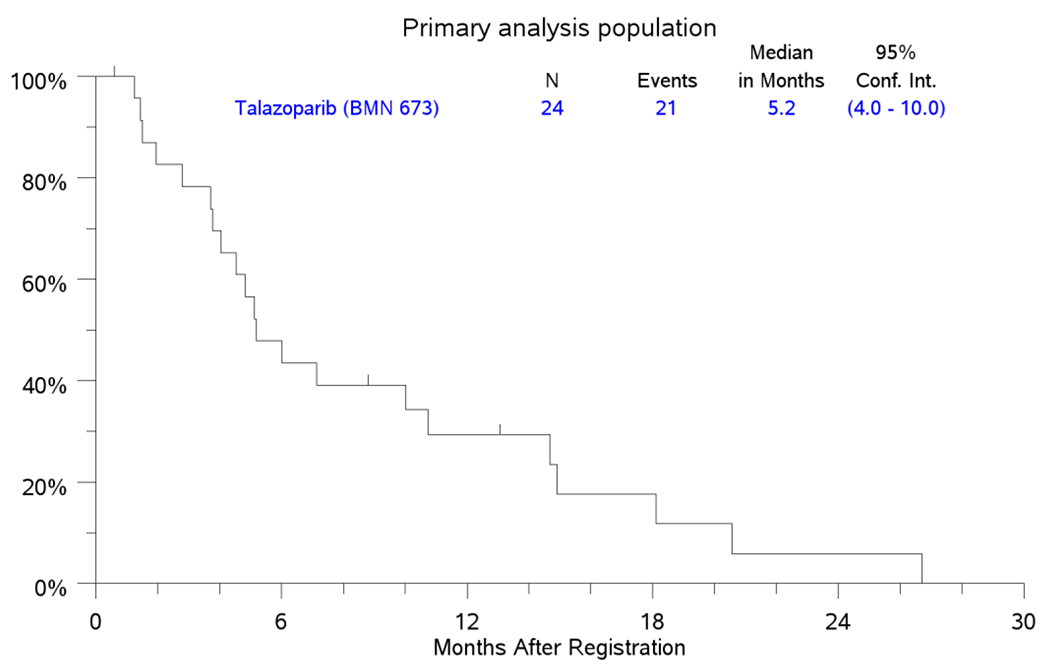
PFS and OS for Primary Analysis Population Patients
2a. PFS
2B. OS
Kaplan-Meier Curves for PFS and OS in the primary analysis population (PAP) counting from the date of registration
Official websites use .gov
A
.gov website belongs to an official
government organization in the United States.
Secure .gov websites use HTTPS
A lock (
) or https:// means you've safely
connected to the .gov website. Share sensitive
information only on official, secure websites.
PFS and OS for Primary Analysis Population Patients
2a. PFS
2B. OS
Kaplan-Meier Curves for PFS and OS in the primary analysis population (PAP) counting from the date of registration