
Figure 3.
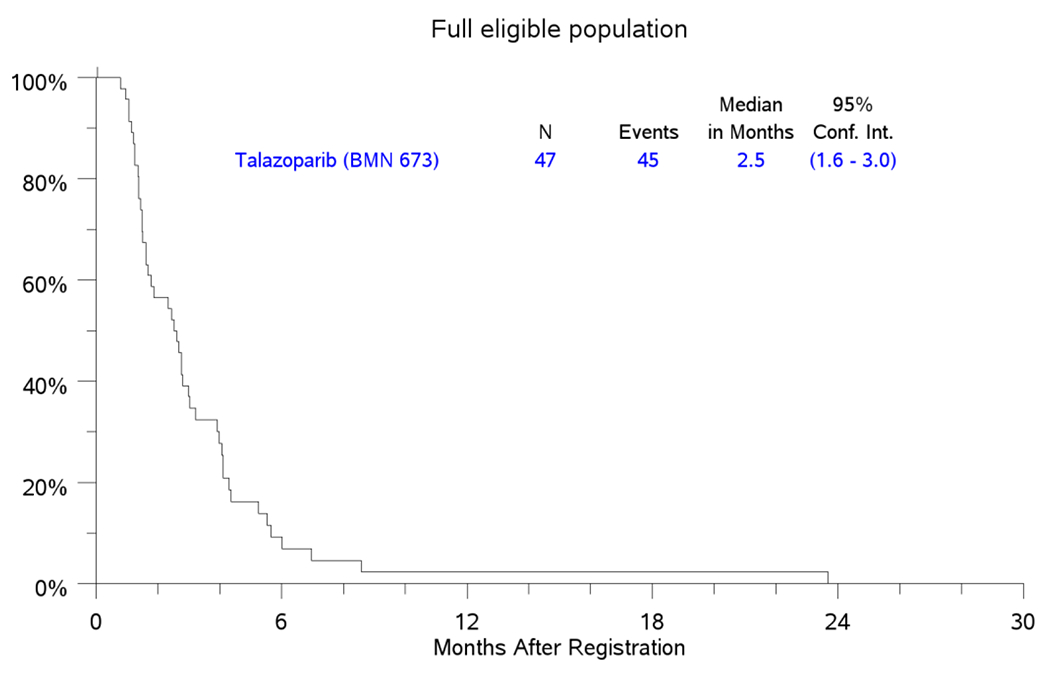
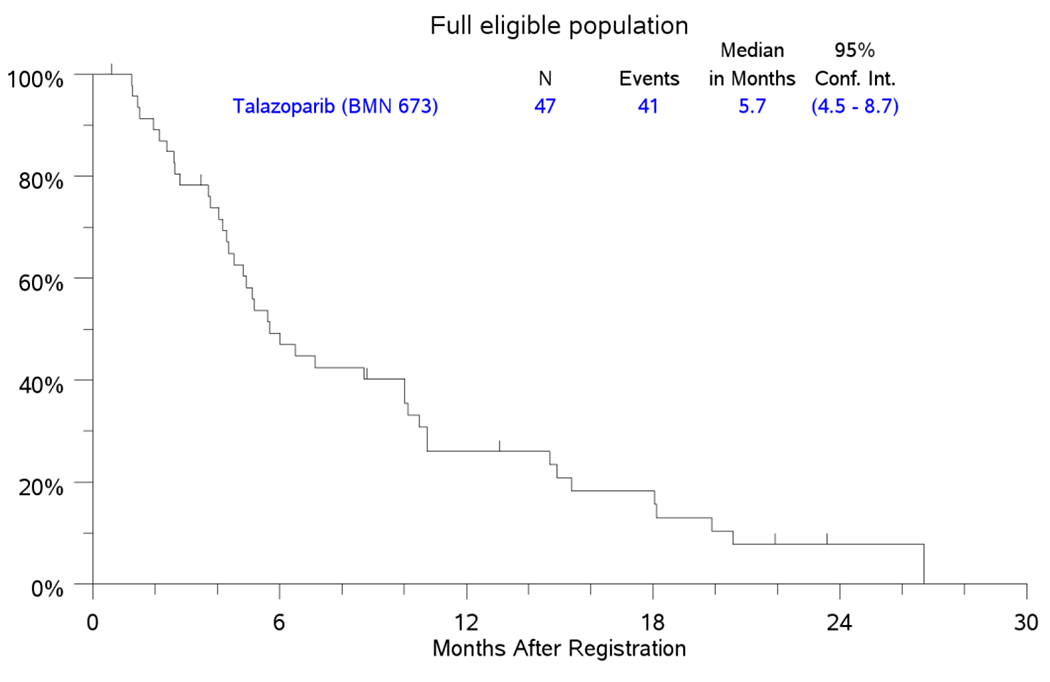
PFS and OS in FEP
3A. KM Plot for PFS.
3B. KM Plot for OS.
Kaplan-Meier Curves for PFS and OS in the full eligible population (FEP) counting from the date of registration.
Official websites use .gov
A
.gov website belongs to an official
government organization in the United States.
Secure .gov websites use HTTPS
A lock (
) or https:// means you've safely
connected to the .gov website. Share sensitive
information only on official, secure websites.
PFS and OS in FEP
3A. KM Plot for PFS.
3B. KM Plot for OS.
Kaplan-Meier Curves for PFS and OS in the full eligible population (FEP) counting from the date of registration.