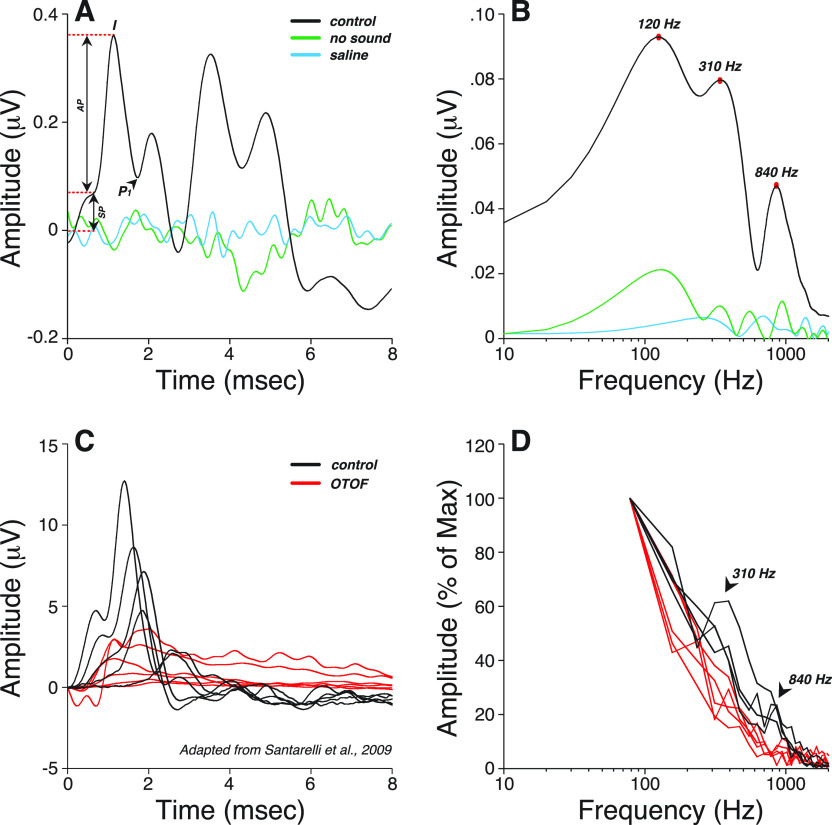
FIG. 5.
(Color online) (A) Averaged click-evoked ABR obtained from all participants shows how measures were visually extracted under a 10–3000 Hz filter. Baseline was defined as the first amplitude point exceeding 2 SD above the mean pre-onset amplitude (–2 to 0 ms). The summating potential (SP) was defined as the difference between baseline and the last inflection point on the rising phase of wave I. Wave I peak or AP was defined as the maximum amplitude 1–2 ms post-stimulus onset, and P1 was defined as the next major trough. As a control for line-locked electrical artifacts, additional waveforms were obtained in one subject with no sound output or with recording electrodes in saline (green and blue traces respectively). (B) Averaged fast Fourier transform (FFT) of the waveforms shown in (A). (C) Cochlear potentials recorded in a normal hearing subject and in a patient with mutations in the OTOF gene in response to clicks at decreasing stimulation levels (110–70 dB pSPL) [adapted from (Santarelli et al., 2009)]. In a patient with OTOF mutations, the SP was present at all levels whilst the AP remained absent at levels as high as 110 dB pSPL. (D) FFTs of the cochlear potentials shown in (C) indicate that both spectral peaks at 310 and 840 Hz observed in normal-hearing controls are absent in a patient with OTOF mutations.

