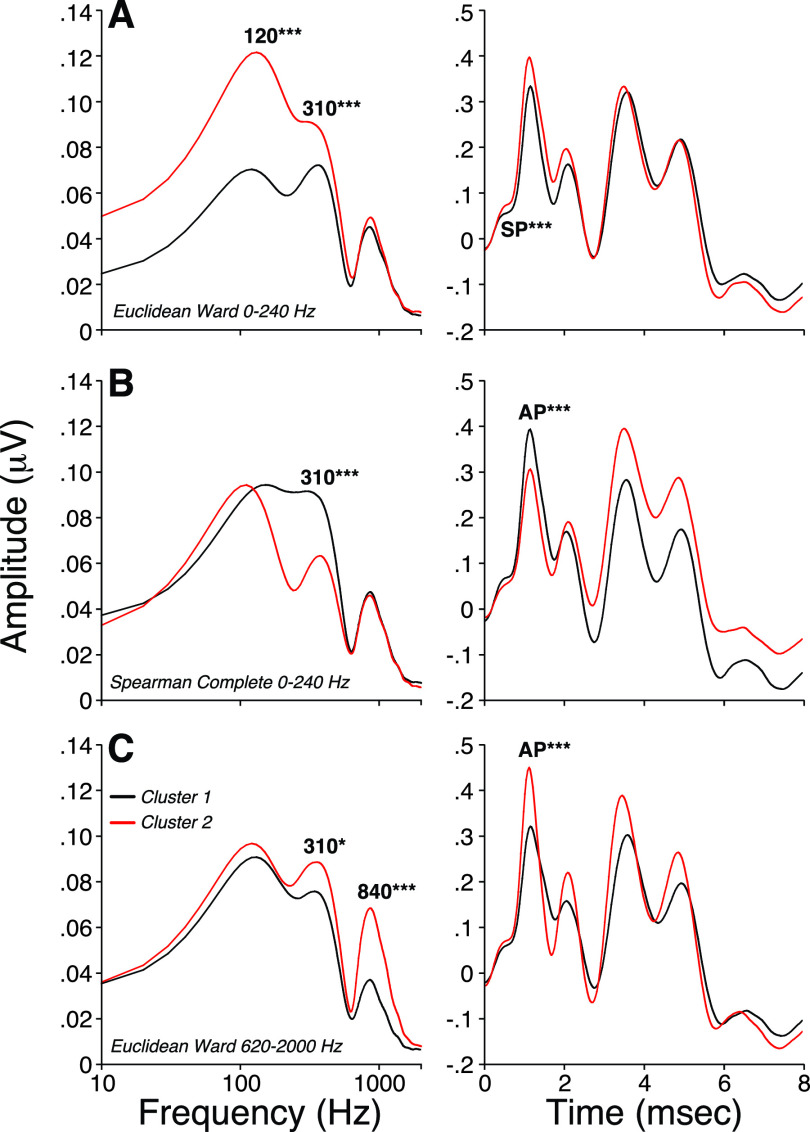
FIG. 7.
(Color online) Hierarchical clustering analysis of spectra obtained from the first 8 ms post stimulus onset of ABR waveforms. Spearman and Euclidean correlations were used to compute the distance between each pair of observations. Rules of hierarchical clustering between pairs were based on either a Ward's method or a complete-linkage clustering method to define spectral groups. The cutting distance was set to separate all data into two clusters of similar size. Averaged ABR waveforms were obtained after identification of the participants composing each spectral group. Two-tailed Student's t test for homoscedastic groups were used to test for differences in mean spectral values at 120, 310, and 840 Hz or in mean SP, AP, and AP-P1 values obtained from ABR waveforms. * p < 0.05; *** p < 0.001.

