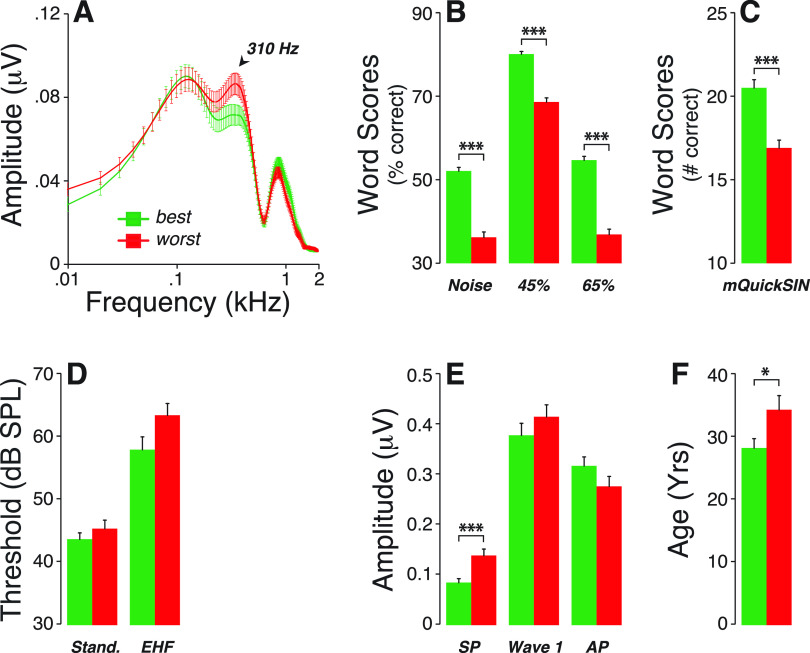
FIG. 8.
(Color online) (A) Averaged FFT of ABR waveforms obtained from the best and worst performers on speech recognition tests. Participants who obtained the worst speech scores (B,C) were those with the largest 310-Hz spectral peak (A). While these differences in speech scores could not be attributed to differences in threshold at standard audiometric frequencies or extended high frequencies (D), they were associated with larger SP amplitudes (E) and older participants (F). * p < 0.05; *** p<0.001.

