FIGURE 2.
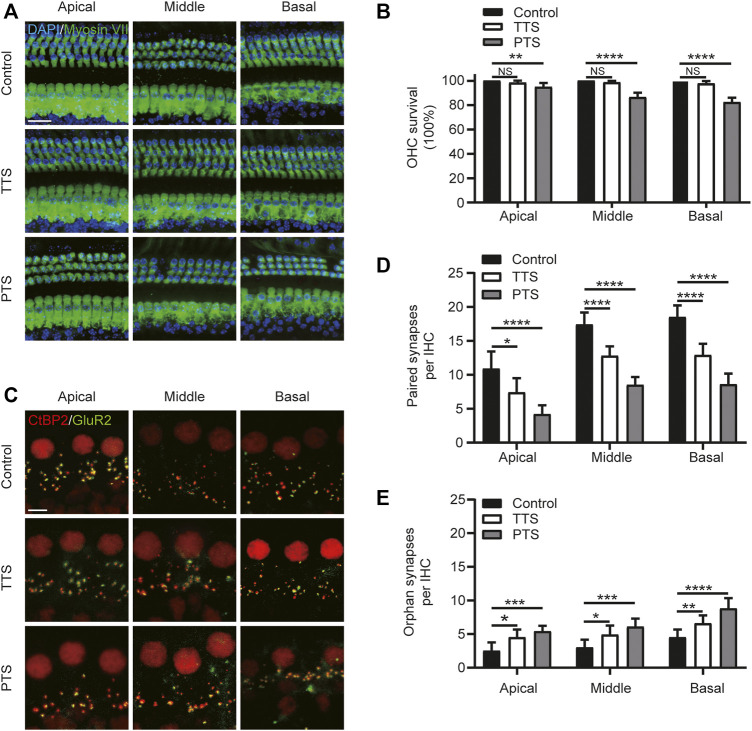
Morphological alterations of mice in the PTS and TTS groups. The basilar membrane was divided into apical, middle, and basal turns for separate observation. (A) Immunohistochemical staining showing changes in the number of hair cells (Myosin VII, green; DAPI, blue) in the PTS and TTS groups. (B) Quantification of Myosin VII and DAPI-positive HCs. (C) Immunohistochemical staining showing changes in the number of presynaptic (CtBP2, red) and postsynaptic structures (GluR2, green) in the IHCs of the PTS and TTS groups. (D) Quantification of CtBP2 and GluR2 overlapping fluorescent spots. (E) Quantification of CtBP2 or GluR2 fluorescent spots alone. (n = 10 per group). TTS, temporary threshold shift; PTS, permanent threshold shift; DAPI, 4, 6-diamidino-2-phenylindole; OHC, outer hair cell, IHC, inner hair cell. NS, not significant; *p < 0.05; **p < 0.01; ***p < 0.001; ****p < 0.0001. Scale bars: A, 20 μm; C, 5 μm.

