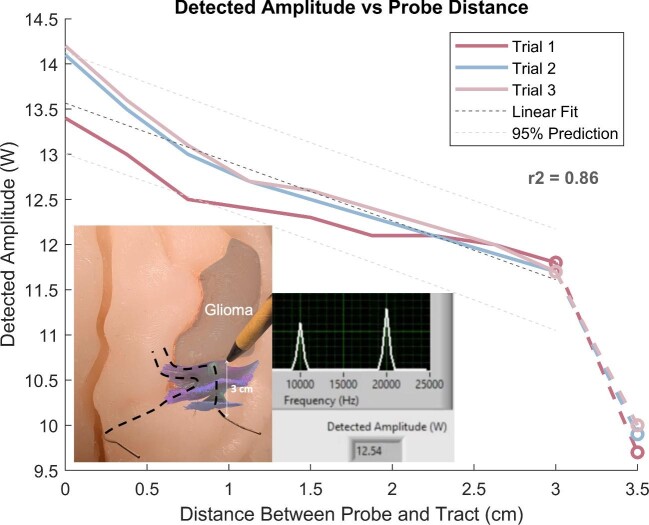
FIGURE 7.
Detected amplitude vs probe distance. Line graph showing the relationship quantified between the distance of the handheld probe to the nearest tract, and the electric field amplitude detected at that point. Linear regression and estimation of fit were performed to find an r2 value of 0.86. 95% CI shown in dashed lines. Left inset image: close-up of data acquisition process using the simulator and probe. Right inset image: example analyzed output on our custom interface.

