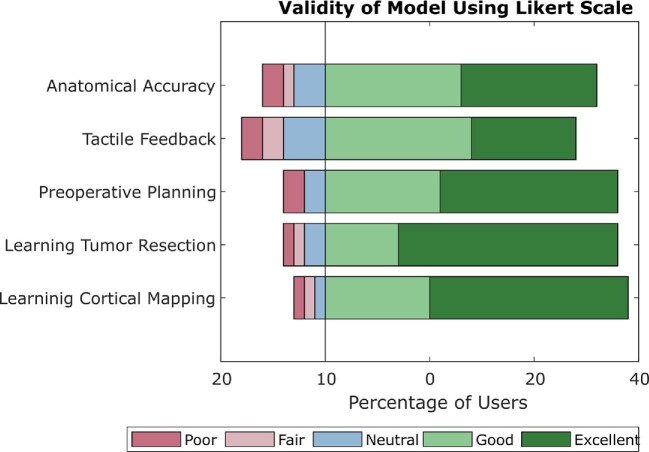
FIGURE 9.
Validity of the model using Likert scale. Stacked bar graph indicating percent positive (green), neutral (blue), and negative (pink) responses to different aspects of the model, including anatomic accuracy, material accuracy or tactile feedback, usefulness in preoperative planning, value in learning the principles of neurological tumor resection, and value in learning the principles of cortical mapping.

