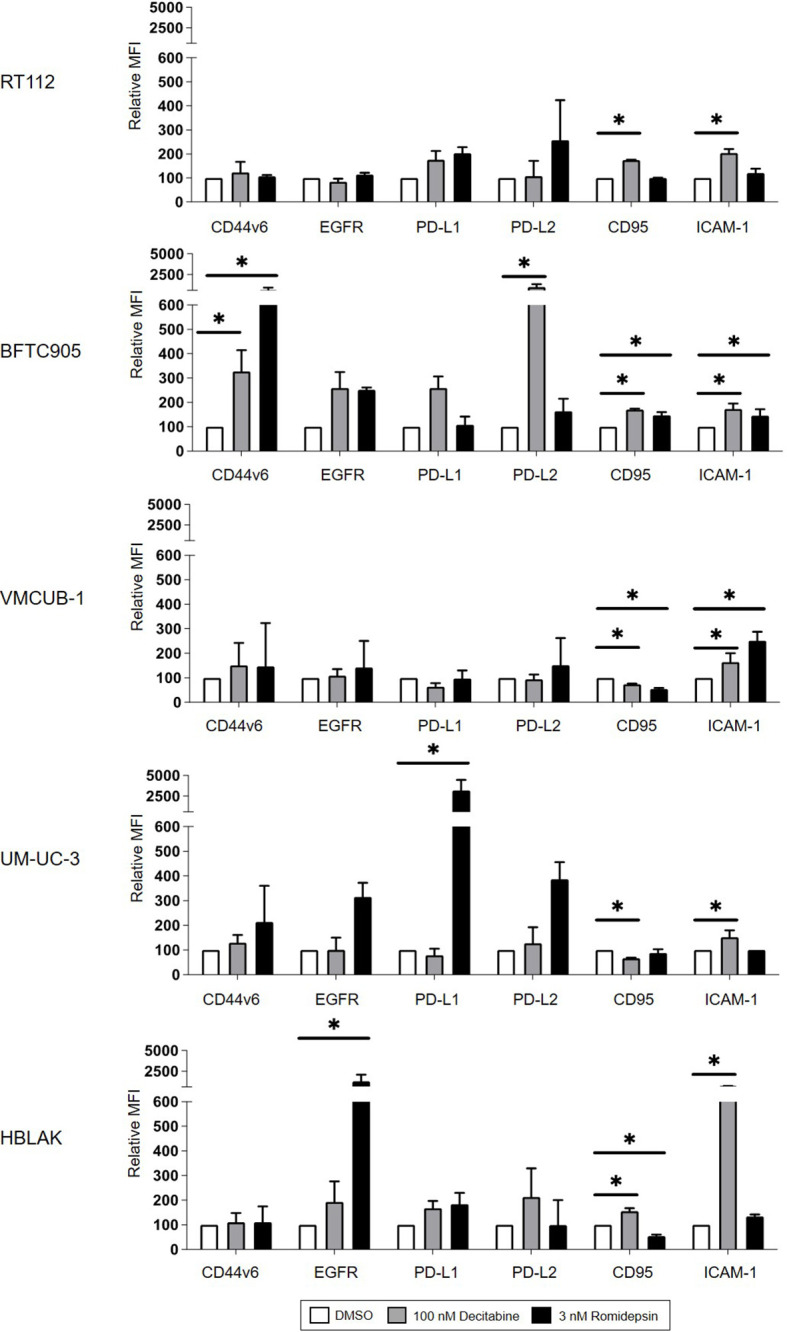
Figure 4.

Cell surface protein expression of CD44v6, EGFR, PD-L1, PD-L2, CD95, and ICAM-1 on target cells after DMSO, DEC, or ROM treatment. The graphs represent changes in median fluorescence intensity (MFI) of each marker normalized to DMSO control. White bars represent the values for DMSO-treated cells, and gray and black bars represent results of DEC- or ROM-treated cells, respectively. Results are shown as the mean ( ± SD) of at least three independent experiments; values of unstained cells are subtracted. p-values were calculated by means of two-way ANOVA and subsequent Dunnett’s correction for multiple comparisons. Statistical significance (p-value ≤ 0.05) is denoted by asterisk.
