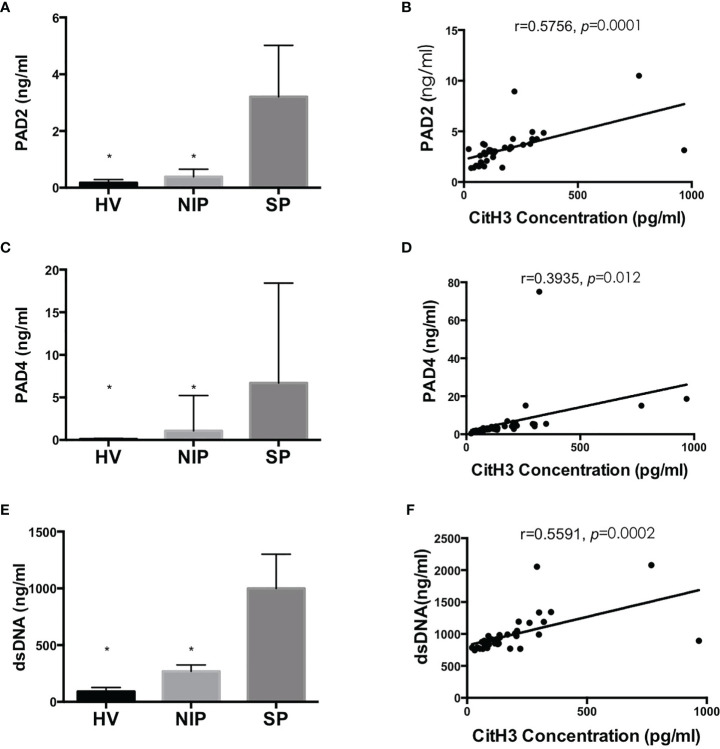
Figure 4.
Blood concentration of PAD2/4 and dsDNA is increased significantly in SP group and is positively correlated with CitH3 concentration. Levels of PAD2 (A), PAD4 (C), and dsDNA (E) were using commercialized kits. Association between CitH3 concentration and PAD2 (B), PAD4 (D), and dsDNA (F) were determined by Pearson’s regression analysis *p < 0.05.

