Figure 3.
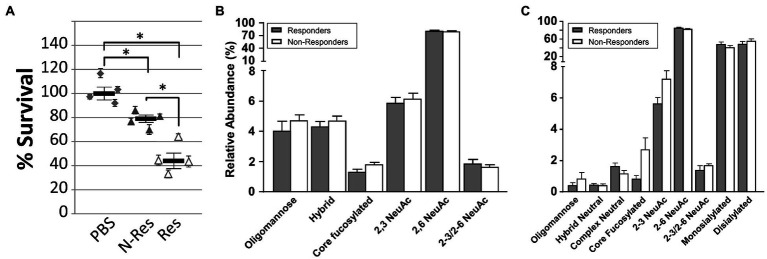
Antibody characterization in sera from responder and non-responder birds. (A) Opsonophagocytosis (OPA) assay. All sera (from Experiment A, B, and C) from negative control (PBS), responder (Res) and non-responder (N-Res) birds, collected on day 27 were pooled and evaluated for their ability to induce killing of Campylobacter by opsonophagocytosis. Each data point represents an independent replicate (each with fresh individually grown Campylobacter cells and individual blood samples from 35-day-old naïve broiler birds that served as a source for white blood cells). Each assay was carried out in triplicate, variations are shown by error bars. The bar represents the average for the four independent assays, error bars depict the standard error of the mean (SEM). Survival is expressed as percentage CFU compared to pooled sera from the negative control group (set to 100%). Statistically significant differences (two-tailed t-test, p<0.05) are indicated by an asterisk. (B) Distribution of N-glycans in total chicken serum analyzed by PGC LC ESI MS/MS. Individual N-glycans as identified from 10 individual responders and five non-responder birds have been summed according to groups representative for biosynthetic features (e.g., core-fucosylation=FUT8 activity, sialic acid linkage type, and structure class). (C) Distribution of N-glycans in enriched chicken IgY analyzed by PGC LC ESI MS/MS. Purified total IgYs from of four individual responders and five non-responder birds were analyzed. Statistical significance was calculated using two-way ANOVA wherein the value of p was ≤0.0001.

