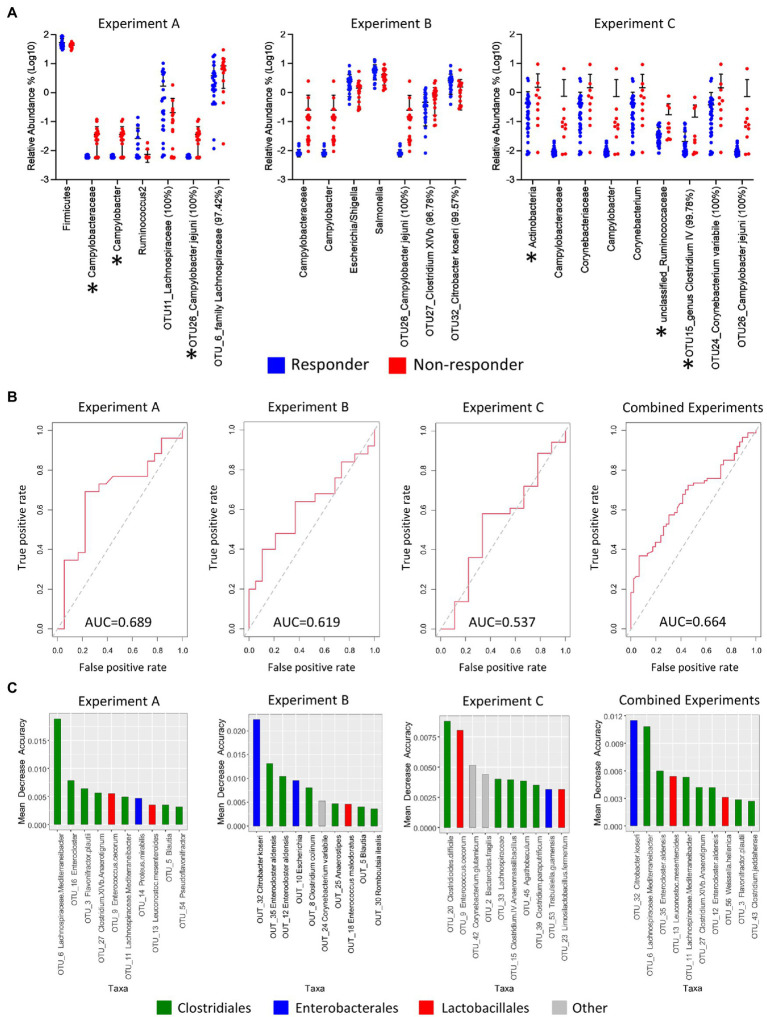
Figure 4.
Significant taxonomic changes between responder and non-responder birds, receiver operating characteristics (ROC) plots, and identification of taxa that are predictive of response per experiment. (A) Scatter dot plot of statistically significant differences in taxa between responders and non-responders analyzed by multiple t-tests followed by false discovery rate (FDR) test using two-stage linear step-up procedure of Benjamini, Krieger, and Yekuteli. Lines represent mean and standard deviation. Percentages beside the names refer to percent identity for each taxon. Significance was established at p<0.05 and q<0.2. Asterisks indicate significant taxa after FDR. Lines represent mean and standard deviations. (B) ROC plots (using OTUs and excluding Campylobacter from the equation) were generated for the response factor and area under the curve (AUC) was calculated for individual experiments and for all experiments combined using the ROCR package in R statistical software. (C) Bar plots of variance importance per experiment as determined by mean decrease accuracy as part of random forest analyses. OTU, operational taxonomic unit; Un, unclassified.

