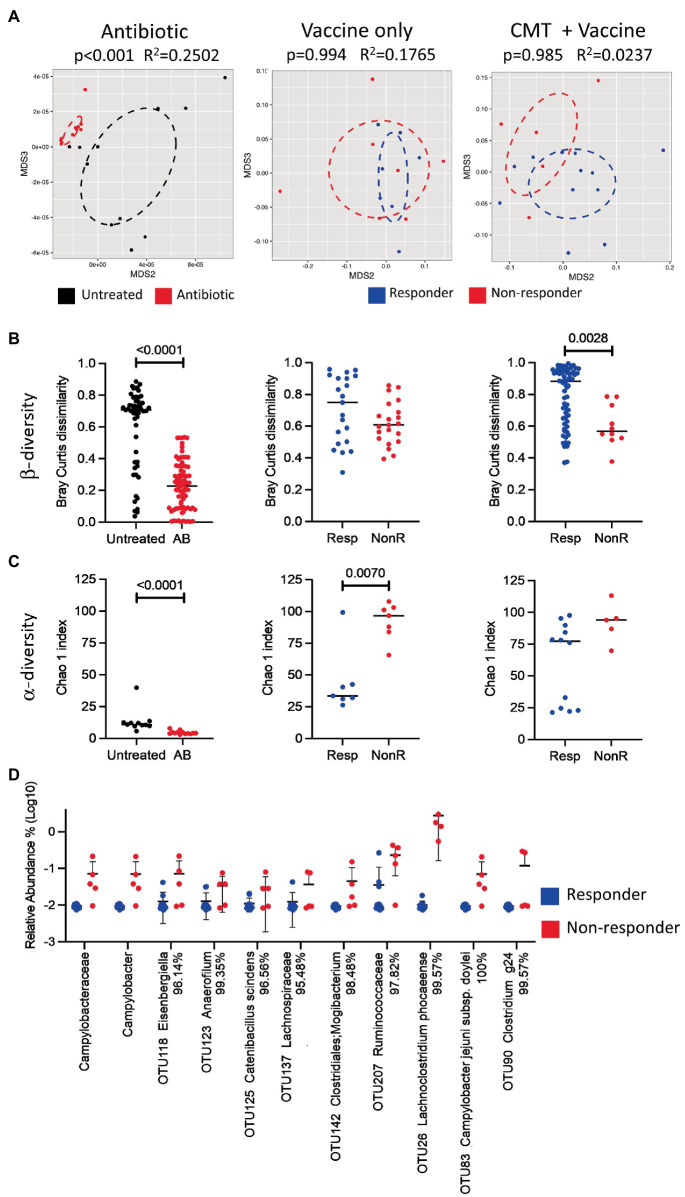
Figure 5.
Effect of antibiotic treatment, vaccine, and cecal microbiota transplant on microbial diversity. (A) NMDS plots analyzed by PERMANOVA test; (B) scatter dot plots of Bray-Curtis dissimilarity analyzed by Mann-Whitney test as a measurement of beta diversity; and (C) scatter dot plots of Chao 1 indexes as a measure of alpha diversity for untreated and antibiotic-treated groups (left), and between responders and non-responders for vaccinated chickens treated with (right) or without (middle) cecal microbiota transplant. OTUs were used for all diversity analyses. Lines represent median values. (D) Scatter dot plot of statistically significant differences in taxa between responders and non-responders analyzed by multiple t-tests. Percentages beside the names refer to percent identity for each taxon. Lines represent mean and standard deviation. Significance was established at p<0.05. CMT, cecal microbiota transplant; AB, antibiotic; Resp, responder; and NonR, non-responder.

