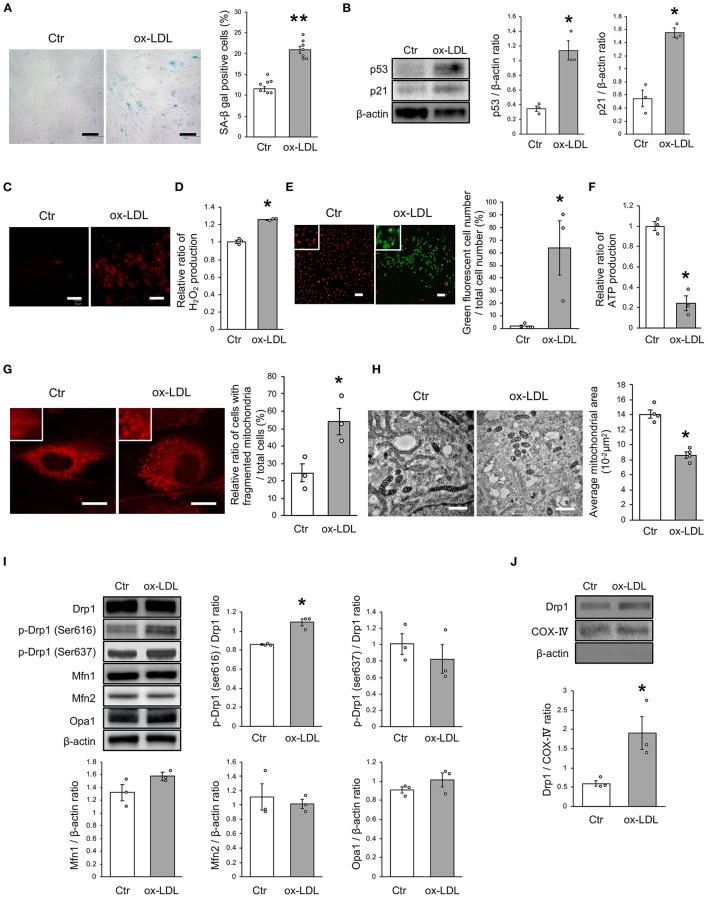
Figure 1.
Ox-LDL treatment induced mitochondrial fission, ROS production, mitochondrial dysfunction, and cellular senescence. (A) Representative images and quantitative analysis of SA-β gal staining of cells treated with ox-LDL or the control. Scale bar = 100 μm. **P < 0.01 vs. Ctr (n = 7 per group). (B) Immunoblots and quantitative analysis of p53, p21, and β-actin in cells treated with ox-LDL or the control. *P < 0.05 vs. Ctr (n = 3 per group). (C) Representative images of MitoSox Red in cells treated with ox-LDL or the control. Scale bar = 100 μm. (D) Relative mitochondrial H2O2 production in cells treated with ox-LDL or the control. *P < 0.05 vs. Ctr (n = 3 per group). (E) Representative images and quantitative analysis of JC-1 staining in cells treated with ox-LDL or the control. Scale bar = 100 μm. *P < 0.05 vs. Ctr (n = 3 per group). (F) Relative mitochondrial ATP production in cells treated with ox-LDL or the control. *P < 0.05 vs. Ctr (n = 3 per group). (G) Representative images of Mitotracker Red in cells treated with ox-LDL or control. Scale bar = 10 μm. *P < 0.05 vs. Ctr (n = 3 per group). (H) Electron microscopic images and quantitative analysis of mitochondria and average mitochondrial areas in cells treated with ox-LDL or the control. Scale bar = 1 μm. *P < 0.05 vs. Ctr (n = 4 per group). (I) Immunoblots and quantitative analysis for Drp1, p-Drp1 (Ser616), p-Drp1 (Ser637), Mfn1, Mfn2, Opa1, and β-actin in cells with ox-LDL or the control. *P < 0.05 vs. Ctr (n = 3 per group). (J) Immunoblots and quantitative analysis for Drp1, COX IV, and β-actin in mitochondrial fractions of cells treated with ox-LDL or the control. *P < 0.05 vs. Ctr (n = 3 per group). All data are presented as the mean ± SEM. Statistical analysis were conducted by Wilcoxon rank sum test (B,D-J) and Student's t-test (A).

