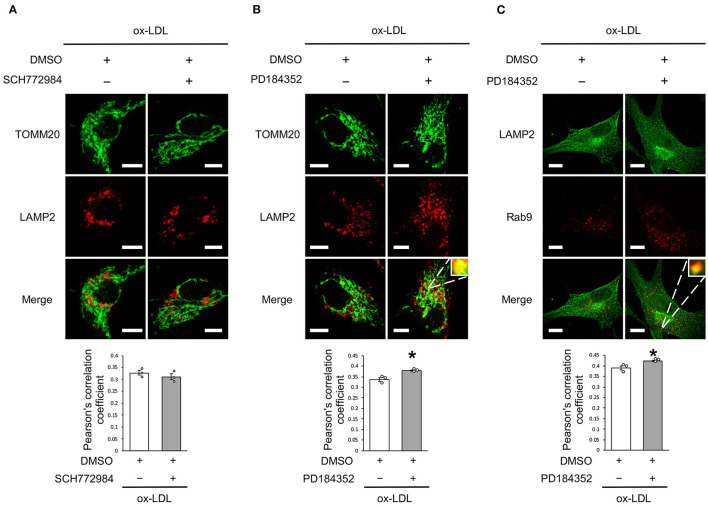
Figure 6.
Rab9-dependent mitochondrial autophagy was not affected by ERK inhibition but was affected by MEK inhibition. (A) Representative images and quantitative analysis of TOMM20 (green) and LAMP2 (red) immunohistochemistry in SCH772984-treated vs. control vehicle-treated cells with ox-LDL. Scale bar = 10 μm. (n = 3 per group). (B) Representative images and quantitative analysis of TOMM20 (green) and LAMP2 (red) immunohistochemistry in PD184352-treated vs. control vehicle-treated cells with ox-LDL. Scale bar = 10 μm. *P < 0.05 when compared with ox-LDL with the control (n = 3 per group). (C) Representative images and quantitative analysis of LAMP2 (green) and Rab9 (red) immunohistochemistry in PD184352-treated vs. control cells with ox-LDL. Scale bar = 10 μm. *P < 0.05 when compared with ox-LDL with the control (n = 3 per group). All data are presented as the mean ± SEM. Statistical analysis were conducted by Wilcoxon rank sum test (A-C).

