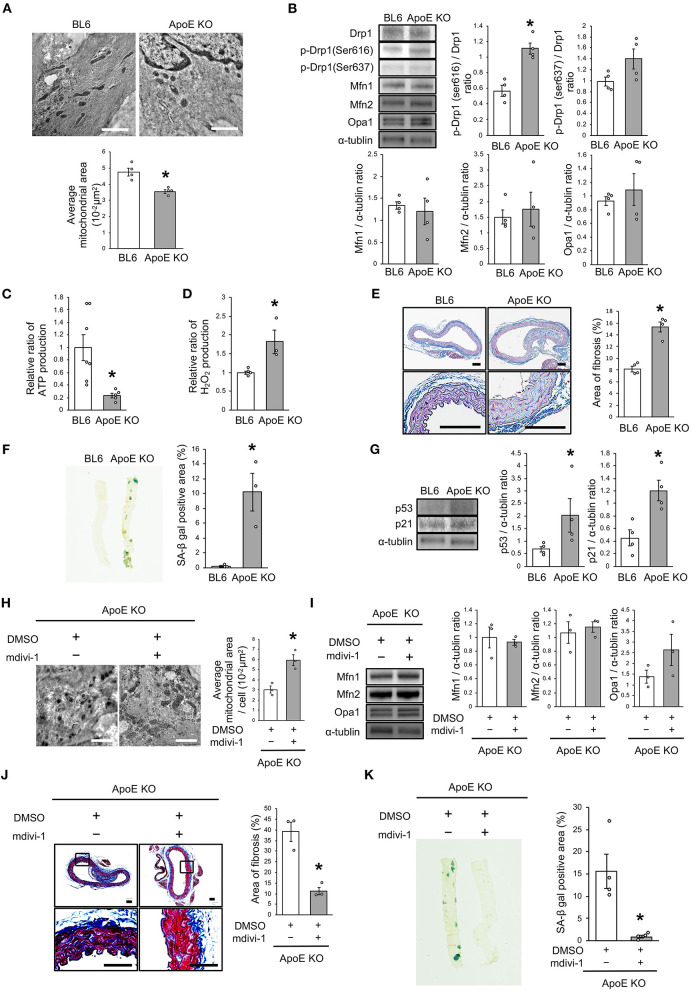
Figure 7.
Drp1 inhibition improved the imbalance of excessive mitochondrial fission and vascular senescence in ApoE KO mice. (A) Electron microscopic images and quantitative analysis of mitochondria and average mitochondrial areas in C57BL/6 and ApoE KO mice. Scale bar = 1 μm. *P < 0.05 vs. C57BL/6 (n = 4 per group). (B) Immunoblots and quantitative analysis for Drp1, p-Drp1 (Ser616), p-Drp1 (Ser637), Mfn1, Mfn2, Opa1, and α-tublin in C57BL/6 and ApoE KO mice. *P < 0.05 vs. C57BL/6 (n = 4 per group). (C) Relative mitochondrial ATP production in C57BL/6 and ApoE KO mice. *P < 0.05 vs. C57BL/6 (C57BL/6; n = 7, ApoE KO mice; n = 5). (D) Relative mitochondrial H2O2 production in C57BL/6 and ApoE KO mice. *P < 0.05 vs. C57BL/6 (n = 4 per group). (E) Representative images and quantitative analysis of Masson's trichrome staining in C57BL/6 and ApoE KO mice. Scale bar = 100 μm. *P < 0.05 vs. C57BL/6 (n = 4 per group). (F) Representative images and quantitative analysis of SA-β gal staining of arteries in C57BL/6 and ApoE KO mice. *P < 0.05 vs. C57BL/6 (n = 3 per group). (G) Immunoblots and quantitative analysis for p53, p21, and α-tublin in C57BL/6 and ApoE KO mice. *P < 0.05 vs. C57BL/6 (n = 4 per group). (H) Electron microscopic images and quantitative analysis of mitochondria and average mitochondrial areas in ApoE KO mice treated with mdivi-1 or the control. Scale bar = 1 μm. *P < 0.05 vs. ApoE KO mice with the control (n = 3 per group). (I) Immunoblots and quantitative analysis for Mfn1, Mfn2, Opa1, and α-tublin in ApoE KO mice treated with mdivi-1 or the control, (n = 3 per group). (J) Representative images and quantitative analysis of Masson's trichrome staining in ApoE KO mice treated with mdivi-1 or the control. Scale bar = 100 μm. *P < 0.05 vs. ApoE KO mice with the control (n = 3 per group). (K) Representative images and quantitative analysis of SA-β gal staining of the arteries in ApoE KO mice treated with mdivi-1 or the control. *P < 0.05 vs. ApoE KO mice with the control (n = 3 per group). All data are presented as the mean ± SEM. Statistical analysis were conducted by Wilcoxon rank sum test (A,B,D-K) and Student's t-test (C).

