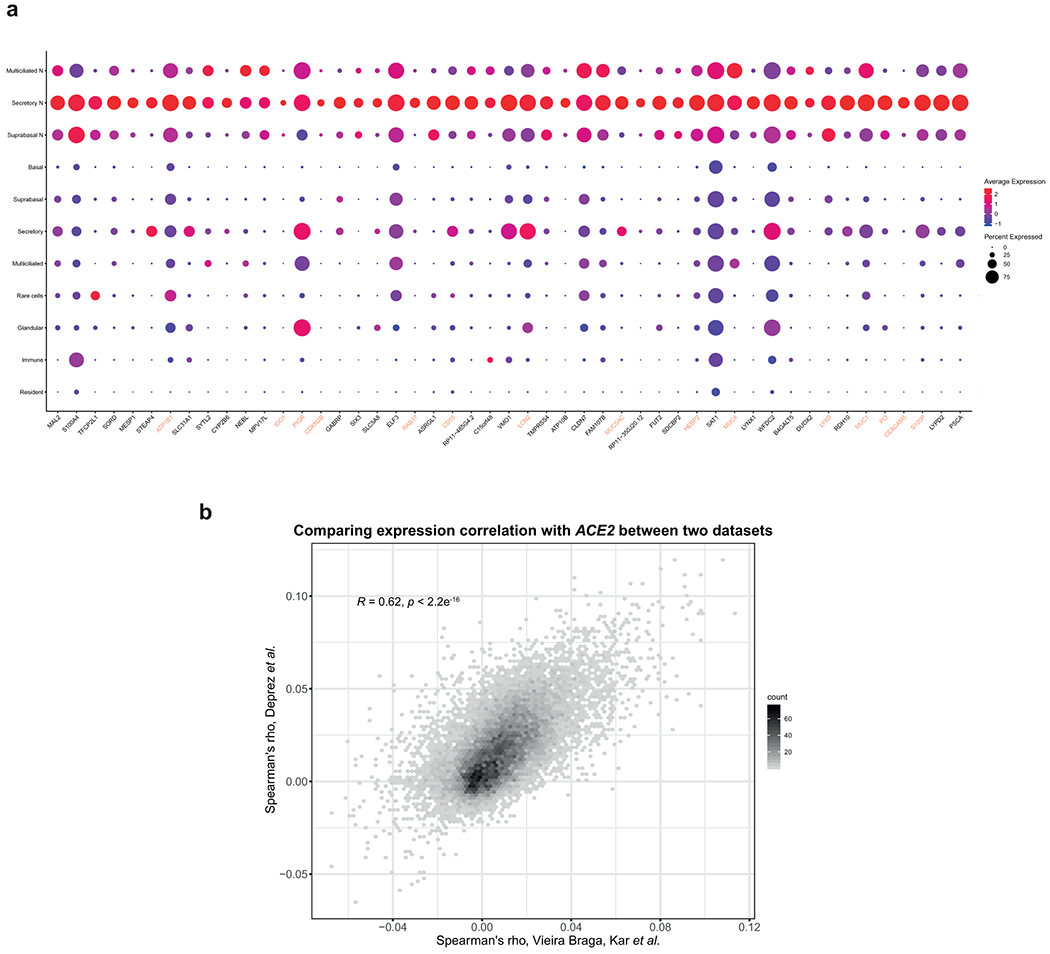
Extended Data Fig. 3. Spearman’s correlation results from the two airway datasets are largely consistent.

a, Respiratory epithelial expression of the top 50 genes correlated with ACE2 expression based on Spearman’s correlation analysis performed on all cells within the Deprez et al. dataset. The colored gene names represent genes that are immune-associated (GO:0002376: immune system process). b, The Spearman’s correlation coefficients of gene expression with ACE2 from the Vieira Braga, Kar et al. airway epithelial dataset and the Deprez et al. airway dataset are shown in the scatter plot. The number of observations for the genes is counted in each bin, the value on the x-axis represents the Spearman’s correlation coefficients from the Vieira Braga, Kar et al. dataset, and the value on the y-axis represents the Spearman’s correlation coefficients from the Deprez et al. dataset.
