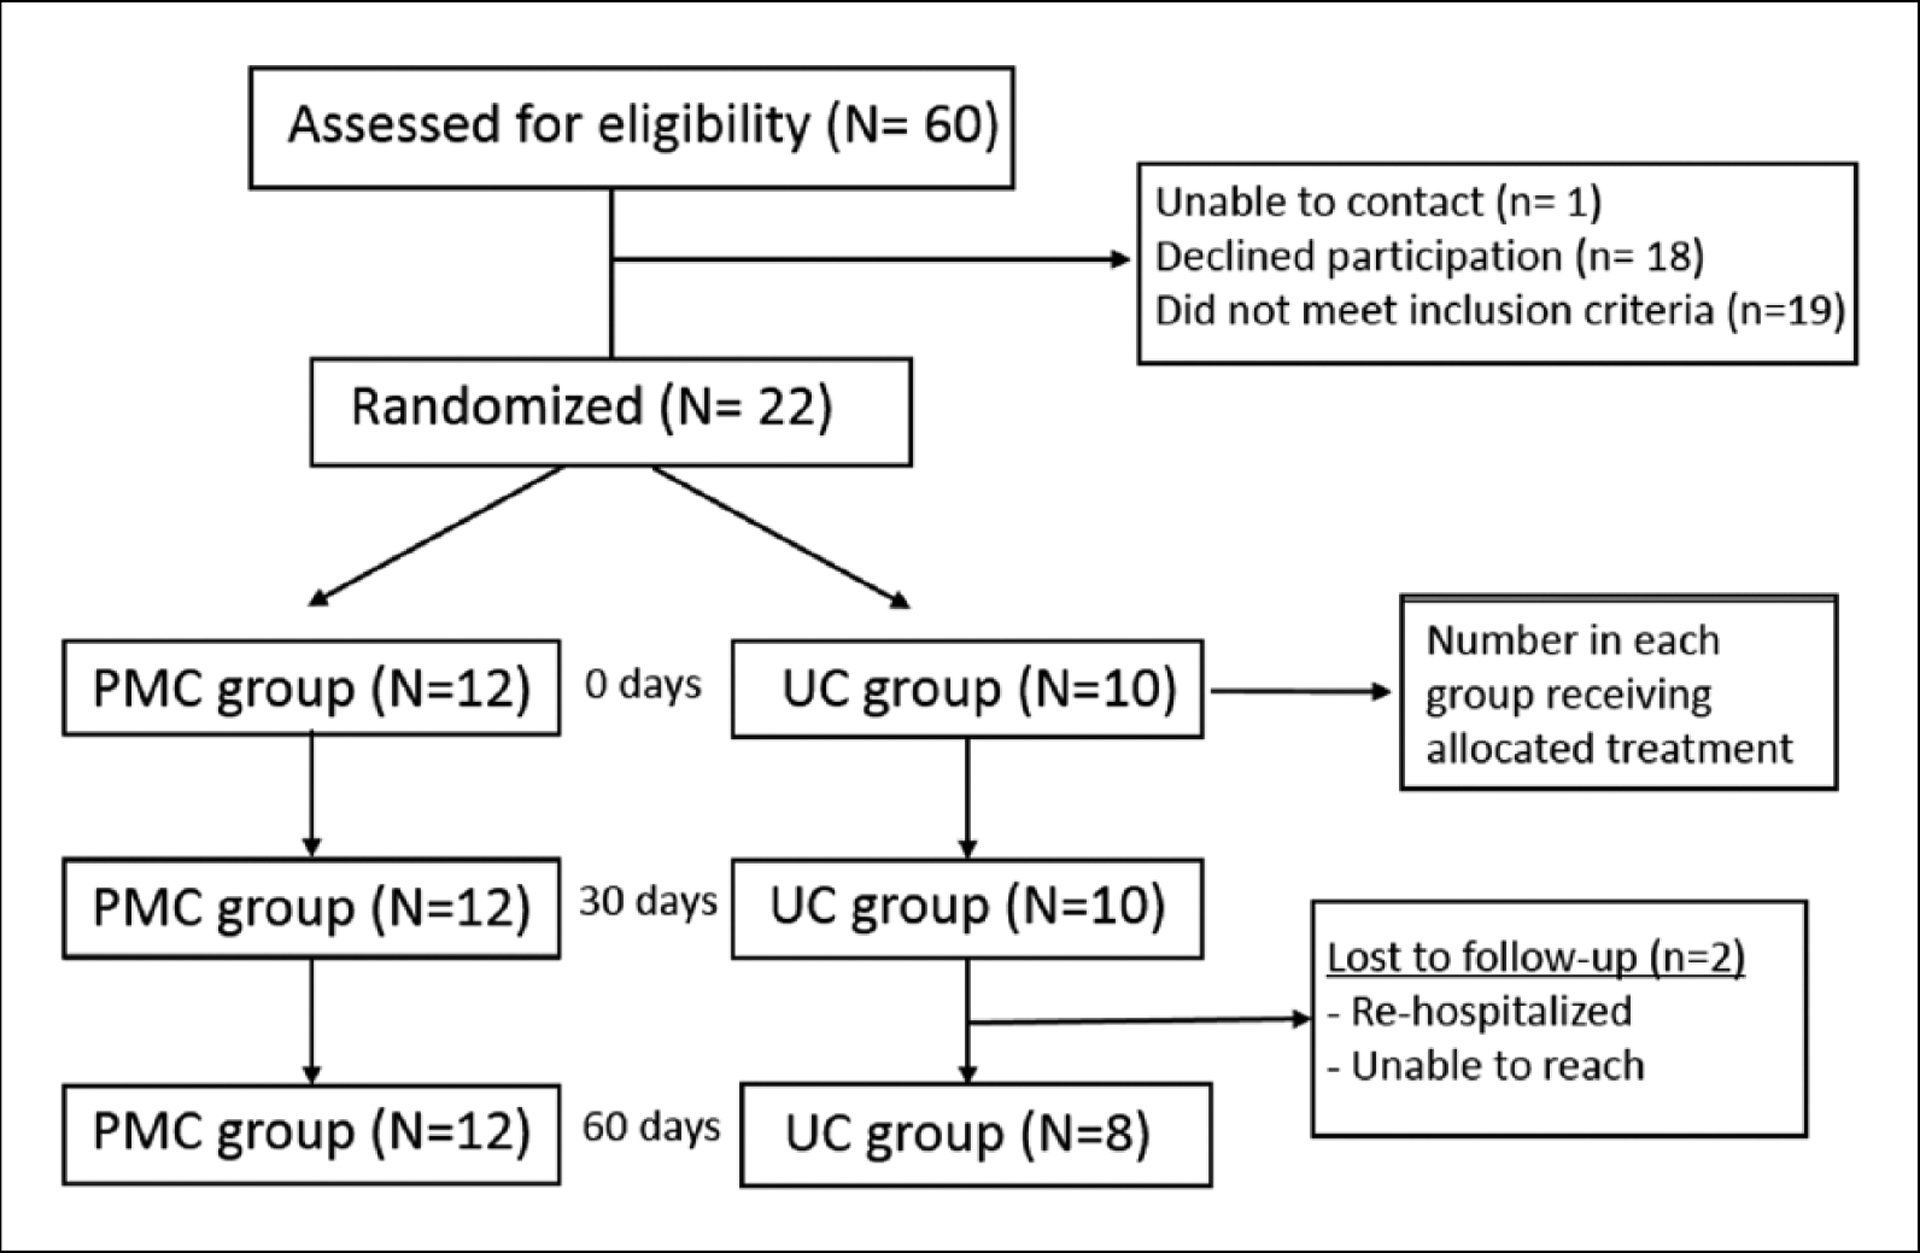
Figure 1.

CONSORT diagram showing recruitment, enrollment, and adherence of study participants. Enrollment numbers and withdrawals, or those lost to follow-up, are indicated in the boxes between time points.
PMC: progressive multicomponent intervention group; UC: usual care group.
