
Figure 2.
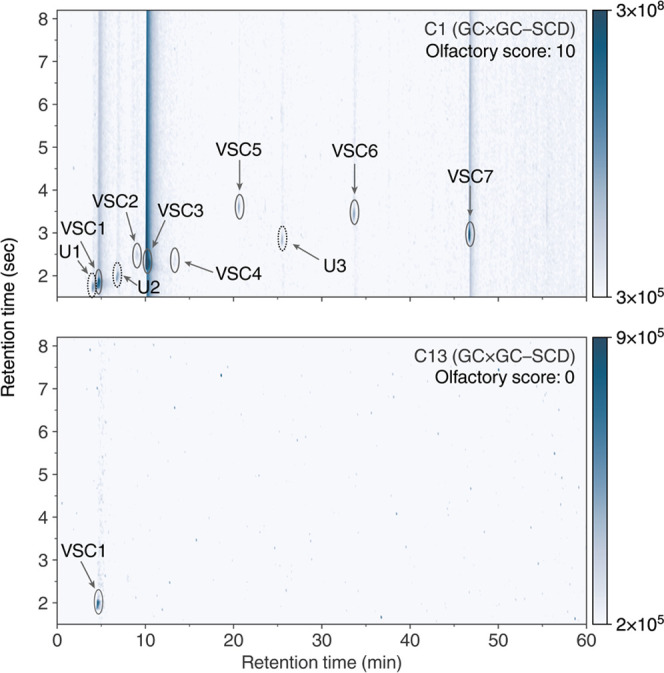
2D chromatograms of GC × GC–SCD data for cultivars with the largest difference in olfactory scores, Bacio Gelato (C1, top), and Black Jack (C13, bottom). Color bars indicate detector response intensity. Significant peaks are circled and annotated, as seen in Table 2 in black. Unknown VSCs are indicated by the black, dashed circles.