
Figure 5.
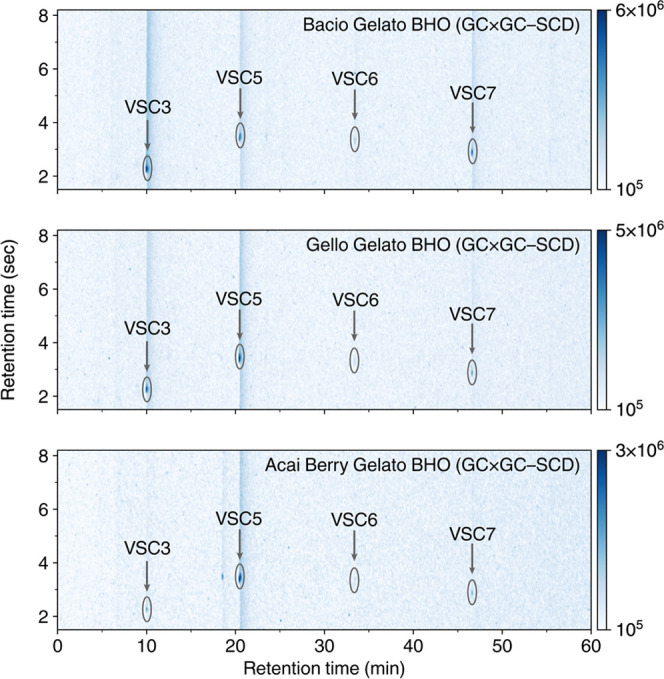
GC × GC–SCD 2D chromatograms for BHO extracts measured. Peak intensity indicates a higher detector response. Significant peaks are circled and annotated. The occurrence of these compounds indicates they can be found in cannabis extract products.