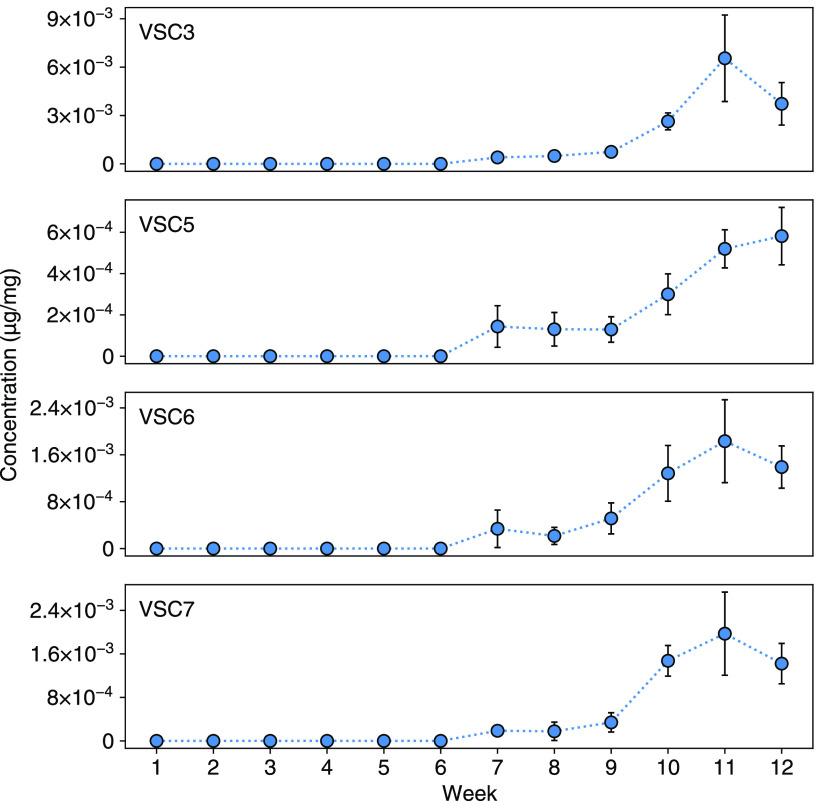
Figure 6.
Concentration of detected VSCs as a function of week during indoor greenhouse trial. Week 1 represents the first week of the flowering stage of plant growth. Week 11 data was taken on the dried and cured flower. Week 12 data was taken 10 days after the end of curing. The rapid increase in VSC concentrations toward the end of the flowering stage was concomitant with increased odor intensity.

