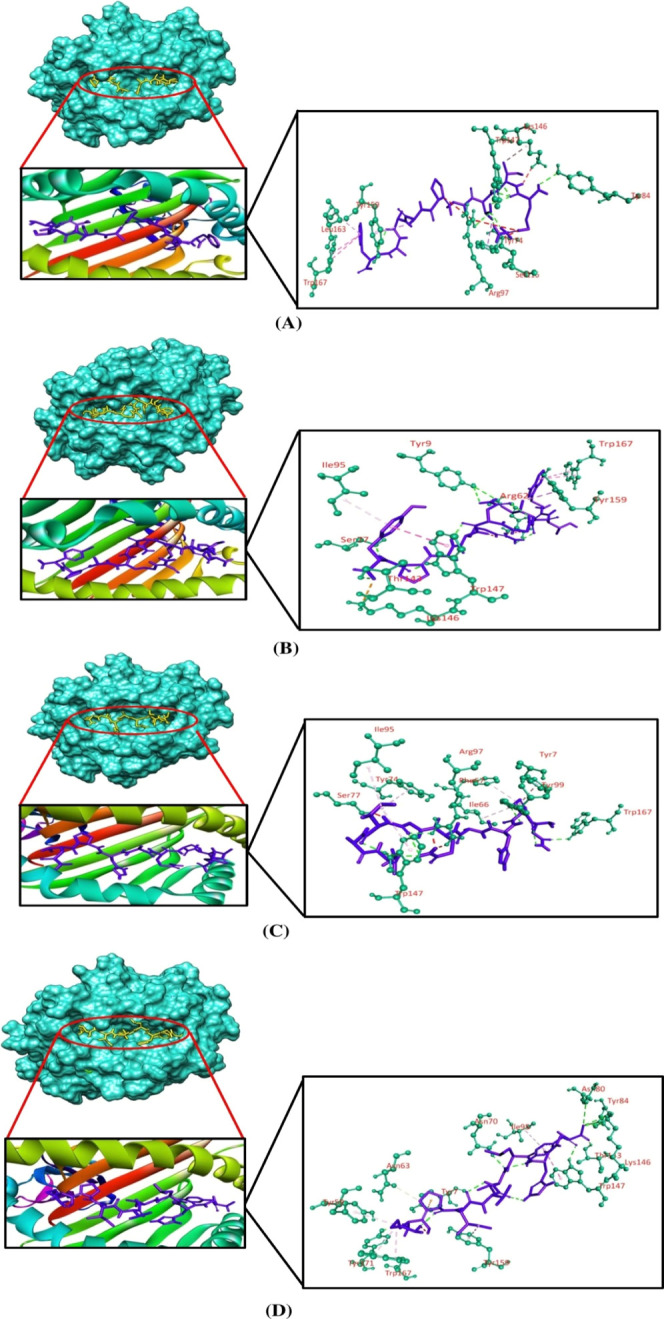
Figure 2.

Three-dimensional representation of molecular docking analysis between the predicted epitope (A) RTTAPAAAF, (B) WTIGNRAPY, (C) NPHAQGIAL, and (D) positive control to the groove of the HLA-B*35:01 allele. The interacting residues are displayed as green balls and sticks, conventional hydrogen bonds are displayed as green lines, pi–pi/pi–alkyl stacking bonds are displayed as pink lines, pi–sigma bonds are displayed as violet lines, carbon–hydrogen bonds are displayed as white lines, unfavorable bumps are displayed as red lines, and attractive charges are displayed as gold lines.
