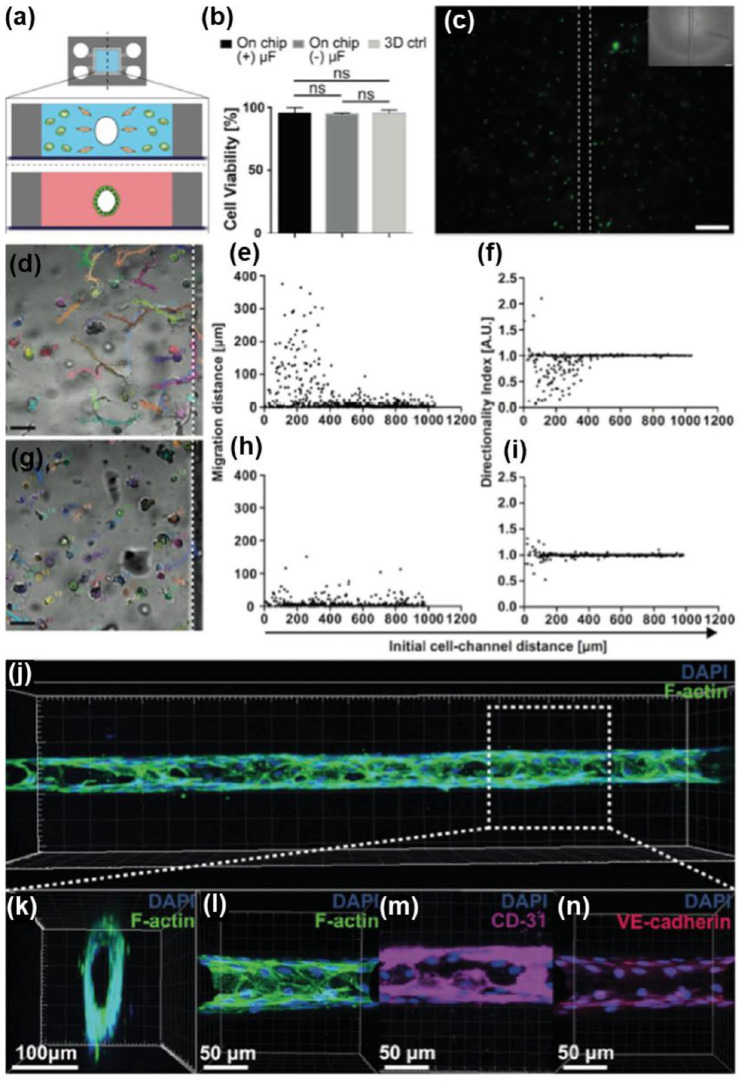
Figure 7.
(a) Schematic representation of the two in vitro models (3D invasion assays and blood vessel-like structures) generated by laser-based fabrication of biomicrofluidic networks in hydrogels. (b) Assessed cell viability by live/dead staining (green: live cells, red: dead cells) with 1 h after the fabrication process (3D ctrl: conventional 3D culture on a 24-well plate, (−) μF and (+) μF: PDMS mounts without and with the fabricated network). (c) Wide-field fluorescent image of a representative, live/dead stained mouse myoblast (C2C12) culture. (d) A representative bright-field image overlapped with the cell tracks of prestarved hMSCs perfused with PDGF-BB for 30 min. (e) Analysis of the migration distance and (f) the directionality index of hMSCs perfused with PDGF-BB for 30 min. (g) Representative bright-field image overlapped with the cell tracks of prestarved hMSCs perfused with medium only. (h) Analysis of the migration distance and (i) the directionality index of hMSCs perfused with medium only. (j) Confocal 3D reconstruction of a hollow HUVEC tube formed in collagen type I. (k) Transversal and (l) frontal plane of the structure. Frontal planes showing endothelial markers immunostainings of (m) CD-31 and (n) VE-cadherin.
Source: Adapted with permission from Brandenberg and Lutolf. 84

