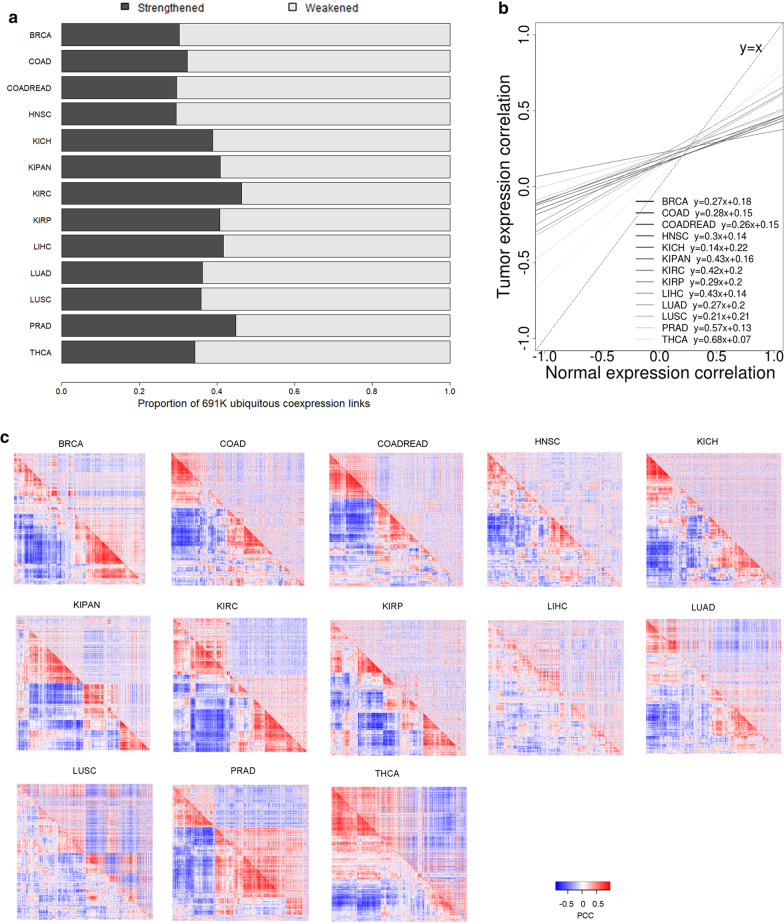
Fig. 1.
Global correlation losses dominated tumor transcriptomes in comparison with paired normal transcriptomes. a By considering the directionality of correlation change from normal to tumor, 691 thousand ubiquitous coexpression pairs were divided into a strengthened part and a weakened part. b Representations of linear regression models between normal PCC and tumor PCC. c Cross-conditional asymmetrical expression correlation heatmaps for 13 cancer types. PCC values for all possible gene–gene pairs formed among the top 500 differentially expressed genes were indicated for the normal phenotype (lower-triangle) and the tumor phenotype (upper-triangle), respectively. The order of genes in the rows was the same as the order in the columns, so that the spots symmetrically positioned off the diagonal line depicted the same pair of genes with possibly varied PCC values across phenotypes

