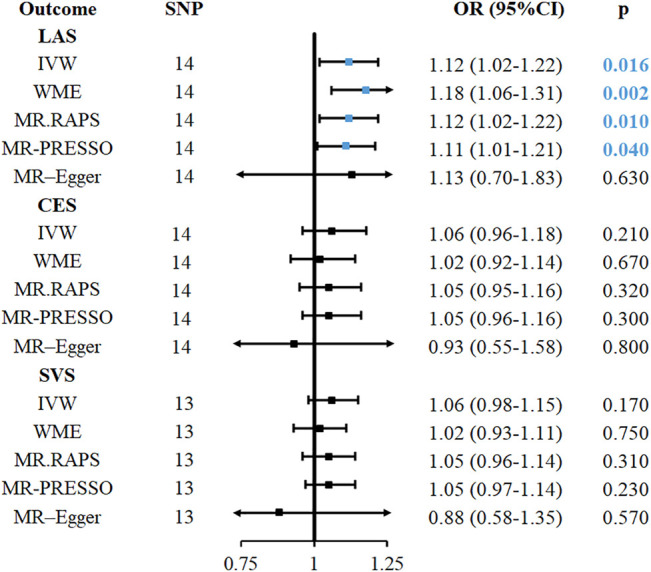
FIGURE 3.

MR analyses causal effect estimates for associations between childhood obesity with IS and its subtypes. CI, confidence interval; IVW, inverse-variance-weighted; MR, Mendelian randomization; OR, odds ratio; SNP, single nucleotide polymorphism; IS, ischemic stroke; LAS, large vessel ischemic stroke; CES, cardioembolic ischemic stroke; SVS, small vessel ischemic stroke; ICH, intracerebral hemorrhage; MR. RAPS, MR-Robust Adjusted Profile Score; MR-PRESSO, MR pleiotropy residual sum and outlier.
