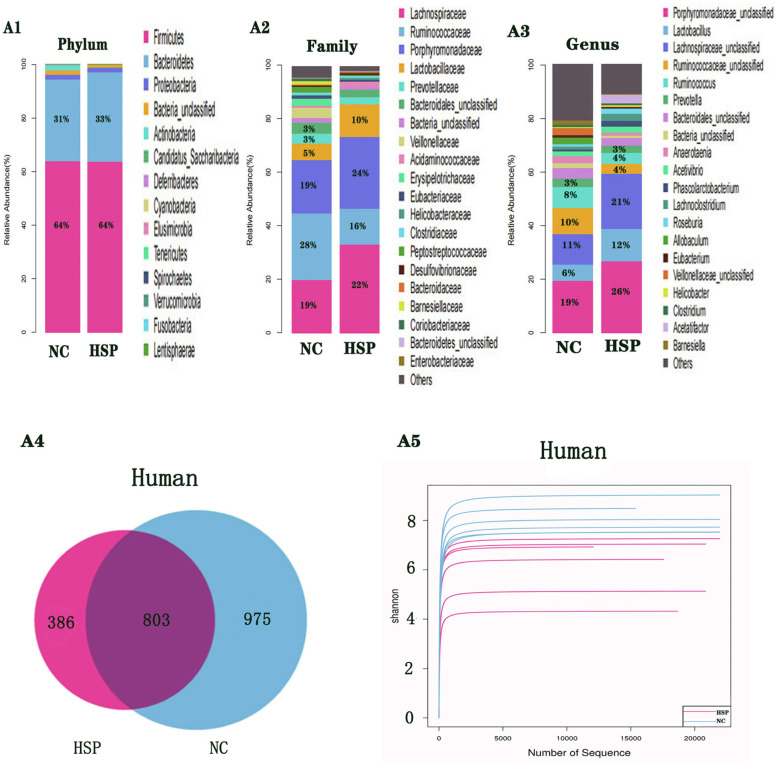
Fig. 3.
1 Composition of bacterial communities based 16S rDNA sequences in HSP patients, Normal Health Children A1. Intestinal flora composition at phylum level; A2. Intestinal flora composition at family level; A3. Intestinal flora composition at genus level. Data were expressed as Mean ± Standard n = 6. 2 Overlapping Venn diagram of OTUs and Shannon exponential curve in HSP patients, Normal Healthy Children OTUs = operational taxonomic units. Shannon exponential curve was used to analyze species abundance and species evenness. A4. Overlapping Venn diagram of OTUs; A5. Shannon exponential curve. Data were expressed as Mean ± Standard n = 6

