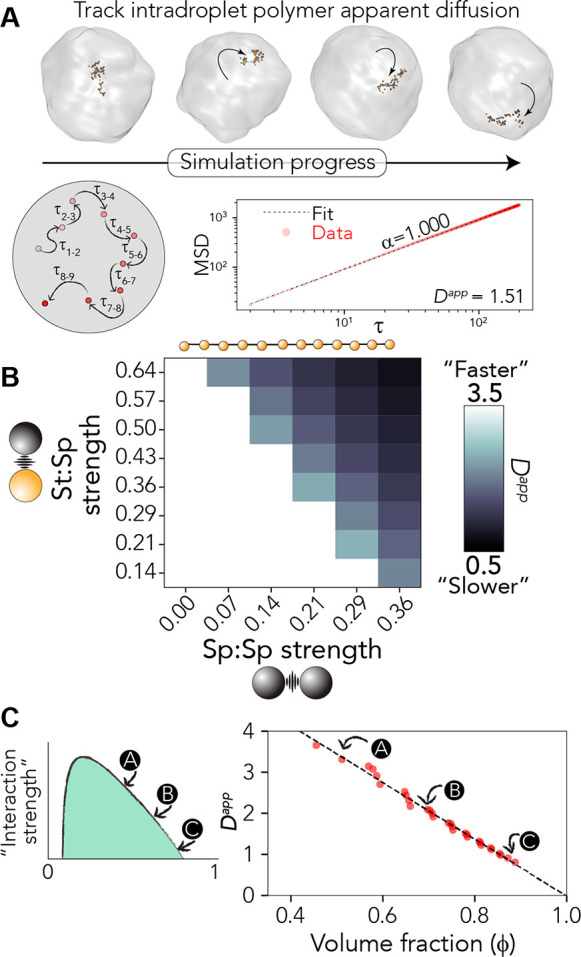
Figure 4.

Apparent diffusion coefficient scales with droplet density. (A) Overview of the analysis approach as applied to the polymer architecture defined in Figure 3. Individual polymers are followed as they “diffuse” within a droplet and fit to extract the diffusive scaling exponent (α) and the apparent diffusion constant (Dapp). Dapp is determined only where simple Brownian diffusion is observed (i.e., α = 1), which occurs in almost all cases (see Figures S1–S3). (B) Dapp as a function of sticker:spacer and spacer:spacer strength. (C) Graphical representation of how density and Dapp relate to one another (left) and all data from panel B plotted as a single master curve of Dapp vs dense-phase volume fraction (ϕden). The linear fit to guide the eye leads to an apparent diffusion constant of 0 when the volume fraction is 1, reflecting the limit in which every lattice site is occupied such that no free sites are available for polymers to move into.
