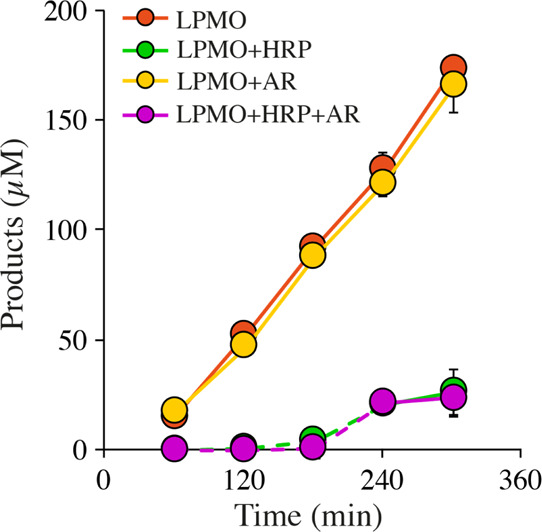
Figure 3.

HRP inhibition for reactions with NcAA9C and GA. Progress curves showing product formation by 1 μM LPMO in the presence of 1 mM GA and 1 mM Glc5 with no supplementation (orange) or supplemented with 100 μM AR (yellow) or 2 μM HRP (green) or both (purple). Note that the HRP reaction does not depend on AR because GA is a substrate for HRP (see text). Dashed lines connect points with values that were close to the limit of detection.
