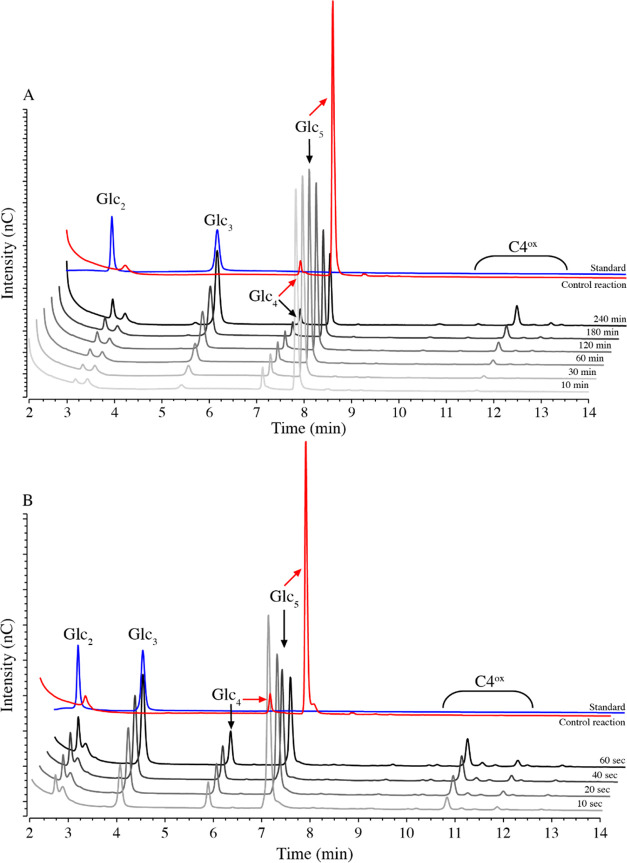
Figure 8.
HPAEC-PAD chromatograms showing product formation in reactions with NcAA9C and Glc5, using mono-oxygenase (A) or peroxygenase (B) setup. Chromatograms for the mono-oxygenase reaction (1 μM LPMO, 1 mM AscA, and 1 mM Glc5 at 37 °C) and peroxygenase reaction (0.25 μM LPMO, 600 μM H2O2, 1 mM AscA, and 1 mM Glc5 at 4 °C) are shown as lines in gradations of gray and black. The chromatograms correspond to the time course experiments shown in Figures 2A and 5B, respectively. The red lines show the chromatograms of the appropriate control reaction without a reductant, after incubation for 240 min (A) or 60 s (B). The blue chromatograms show the Glc2 + Glc3 standard.

