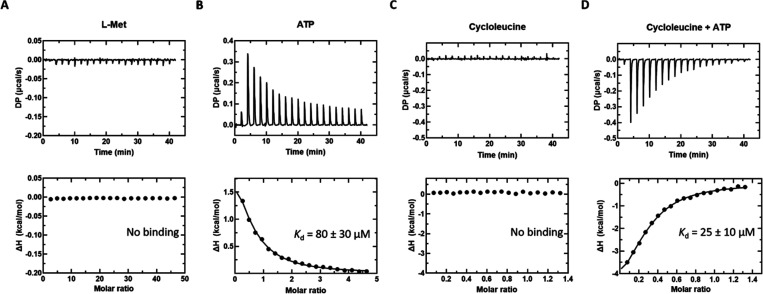
Figure 5.
ITC thermograms of l-Met, ATP, and l-cLeu (± ATP) titrated into Mat2A. (A) l-Met (20 mM) titrated into Mat2A (87 μM). (B) ATP (2 mM) titrated into Mat2A (87 μM). (C) l-cLeu (2 mM) titrated into Mat2A (205 μM). (D) l-cLeu (2 mM) + ATP (2 mM) titrated into Mat2A (205 μM) + ATP (2 mM). All titrations performed at 20 °C. Unprocessed thermograms (top panels) and the binding isotherm from the integrated thermogram fit to the One Set of Sites model using the MicroCal PEAQ-ITC analysis software (bottom panels). Circles indicate the integrated heat, and the curve represents the best fit. Data shown are representative of four independent experiments.

