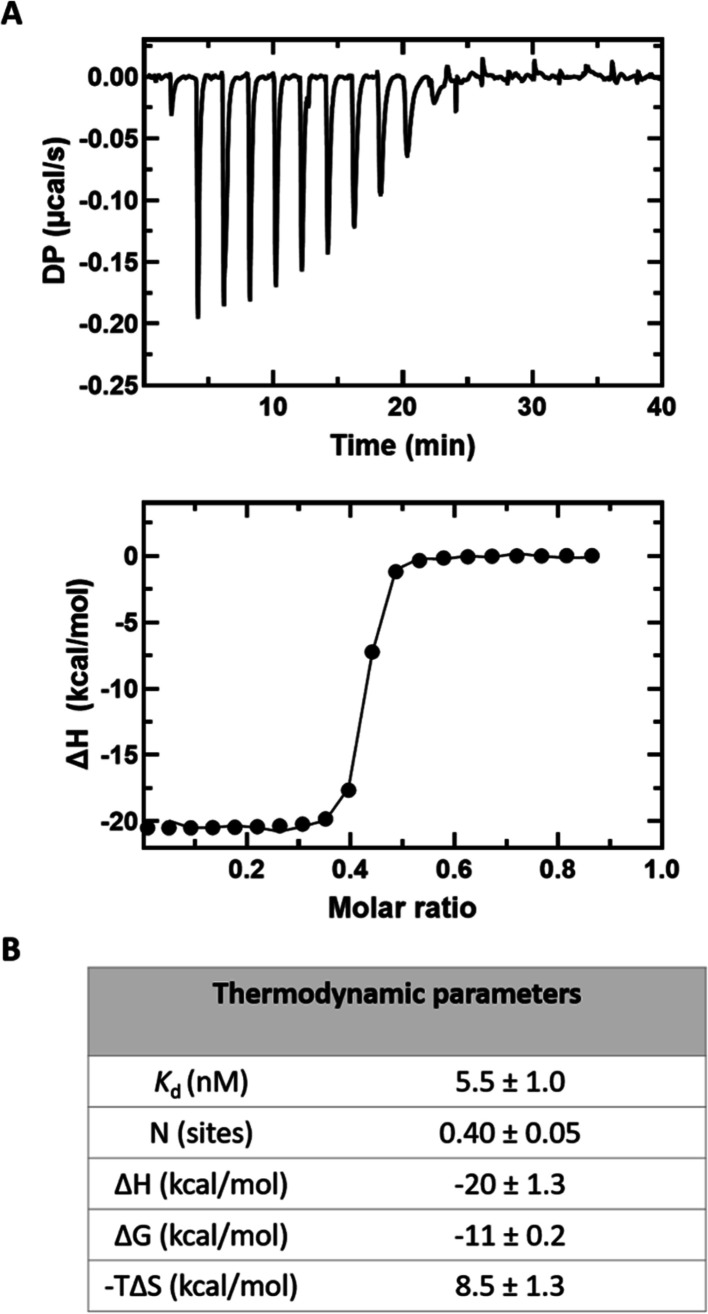
Figure 6.
Mat2A binding to Mat2B in solution. (A) Mat2B (50 μM) titrated into Mat2A (14 μM). Raw thermogram (top panel) and the binding isotherm from the integrated thermogram fit using the One Set of Sites model in the MicroCal PEAQ-ITC analysis software (bottom panel). Circles indicate the integrated heat, and the curve represents the best fit. (B) Thermodynamic parameters. Reported values are averages from six independent titrations, and the error is the standard deviation.

