Figure 2.
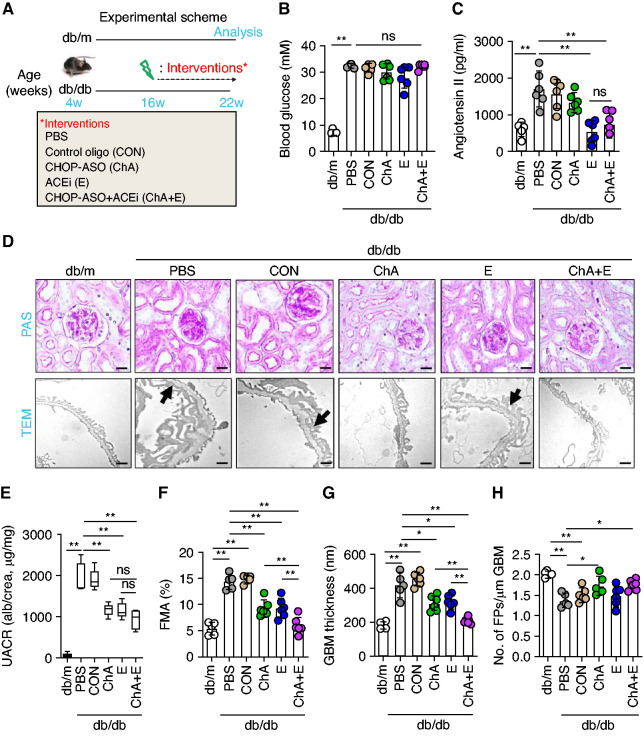
CHOP inhibition provides protection on top of ACEi to halt the progression of DKD. (A) Experimental scheme. (B and C) Scatter plot with bars and box plots summarizing (B) blood glucose levels and (C) plasma angiontensin II levels, respectively. (D–H) Representative renal histologic sections showing (D, upper panel) PAS staining, (D, lower panel, the arrows indicate exemplary podocyte foot processes effacement) transmission electron microscopy (TEM). (E) Box plots summarizing urine albumin-creatinine ratio (UACR). Scatter plot with bars summarizing glomerular extracellular matrix accumulation as indicated with (F) PAS staining (fractional mesangial area, FMA), (G) glomerular basement membrane thickness (GBM), and (H) number of podocyte foot processes per micrometer GBM as analyzed by TEM images. Nondiabetic mice (db/m, 22 weeks old) and 22-week-old diabetic db/db mice treated for 6 weeks (starting at the age of 16 weeks) with PBS, CON, ChA, E, or ChA+E. Scale bar, (D, upper panel) 50 µm or (D, lower panel) 1 µm; *P≤0.05, **P≤0.01, ns, nonsignificant (B, C, E–H: ANOVA); each dot in scatter plots represents one sample.

