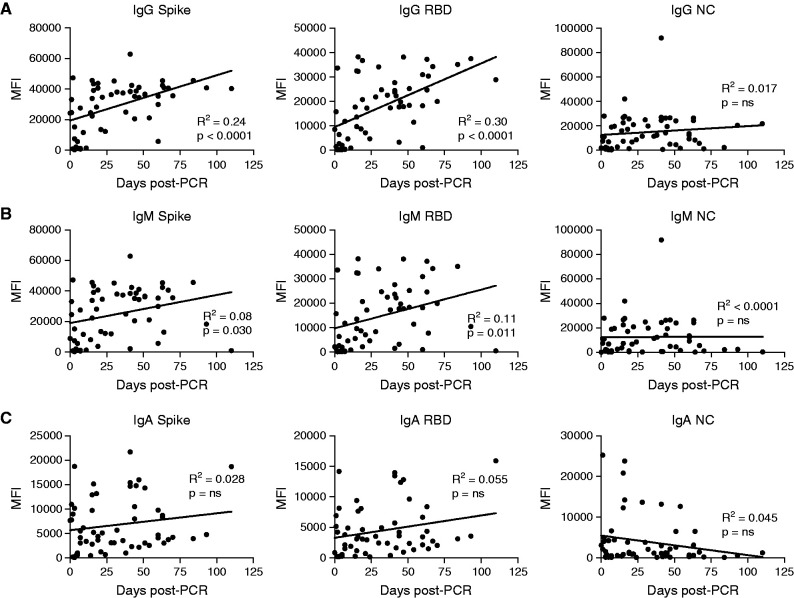
Figure 3.
Kinetic analysis of IgG, IgM, and IgA. (A) IgG, (B) IgM, and (C) IgA levels specific for trimeric spike, RBD, or NC on the basis of MFI plotted against the number of days after PCR-based diagnosis of SARS-CoV-2 infection for samples obtained up to 100 days after diagnosis. The line is derived from simple linear regression. P values indicate the significance of the line slope. ns, not significant. MFI, mean fluorescence intensity.

