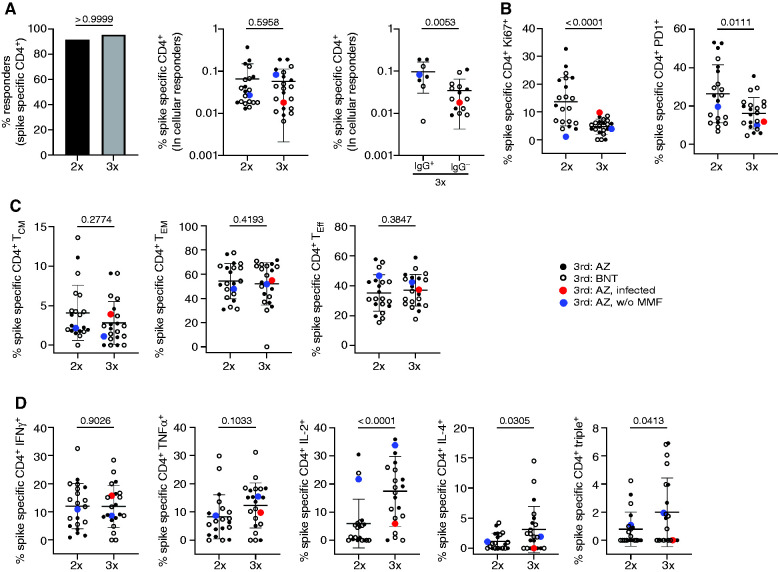
Figure 2.
Assessment of T cell reactivity. PBMC of KTR (n=24) were stimulated or not with spike peptide mix. Specific CD4+ T cells were identified and quantified 7±2 days after the second and third vaccination by FACS according to CD137 and CD154 coexpression. Depicted are (A) the percentage of individuals with a cellular response (left, Fisher’s exact test), frequencies of specific CD4+ T cells (middle, paired Wilcoxon test), and frequencies within humoral responders (anti–S1 IgG+) and nonresponders (anti–S1 IgG-) (right, unpaired t test). (B) Frequencies of antigen-specific CD4+ T cells expressing Ki67 (left, paired t test) or PD1 (right, paired t test). (C) Memory/effector subset differentiation of spike-reactive CD4+ T cells (TCM, central memory, left, paired Wilcoxon test; TEM, effector memory, middle, paired t test; Teff, effector right, paired t test, T cells). (D) Expression of IFN-γ (paired t test), TNF-α (paired t test), IL-2 (paired Wilcoxon test), and IL-4 (paired Wilcoxon test in antigen-specific T cells including analysis of IFN-γ+TNF-α+IL-2+ “triple+” polyfunctional (paired Wilcoxon test) cells. Where applicable, graphs show mean±SD.

