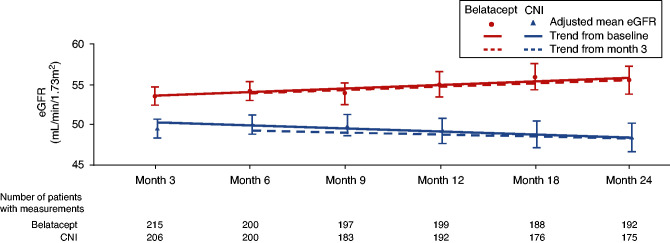
Figure 4.
Plots of adjusted mean eGFR over time from randomization (solid lines) and month 3 (dotted lines) indicated a sustained improvement in renal function in the belatacept conversion group during the 24-month period. The trend in baseline-adjusted mean eGFR over 24 months showed an estimated positive slope of 0.68 ml/min per 1.73 m2 in the belatacept group and a negative slope of −0.11 ml/min per 1.73 m2 in the CNI group. For patients who died or had graft loss, missing eGFR values were imputed to zero. Adjusted mean eGFR values (error bars representing 95% CIs) over time are shown along with trend lines on the basis of a linear mixed model using treatment group, baseline eGFR, month (continuous), and interaction term treatment by month as fixed effects. These models also included a random intercept and slope for month. A separate model was fitted for the trend analysis from baseline (shown as solid lines) and month 3 (shown as dashed lines).

