. 2014 Apr 22;84(6):1079–1085. doi: 10.2319/121913-929.1

Figure 3.

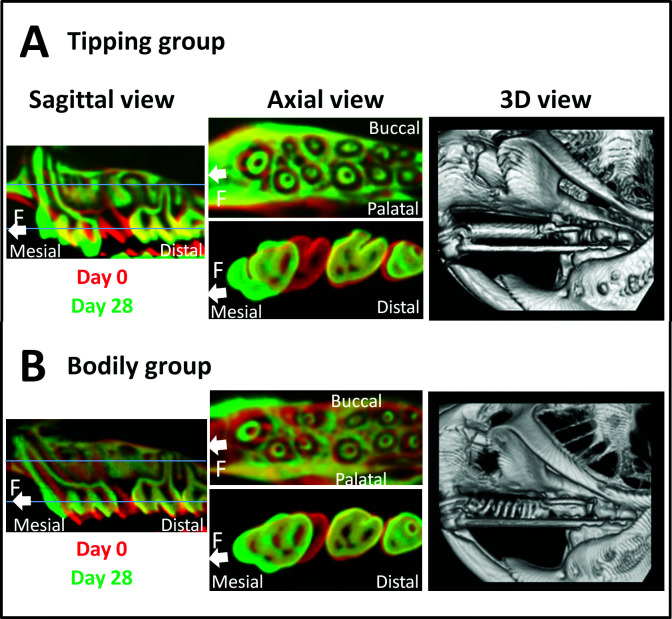
Figure 3. Micro-CT images. (A) Tipping tooth movement group. (B) Bodily tooth movement group. Superimposition of micro-CT images on days 0 and 28; sagittal views are presented on the left, and two different axial views are presented in the middle. The upper axial image displays a slice of the apical region of the tooth, whereas the lower image displays a slice of the cervical region of the tooth. Reconstructed 3D micro-CT images on day 28 are shown on the right.

Micro-CT images. (A) Tipping tooth movement group. (B) Bodily tooth movement group. Superimposition of micro-CT images on days 0 and 28; sagittal views are presented on the left, and two different axial views are presented in the middle. The upper axial image displays a slice of the apical region of the tooth, whereas the lower image displays a slice of the cervical region of the tooth. Reconstructed 3D micro-CT images on day 28 are shown on the right.