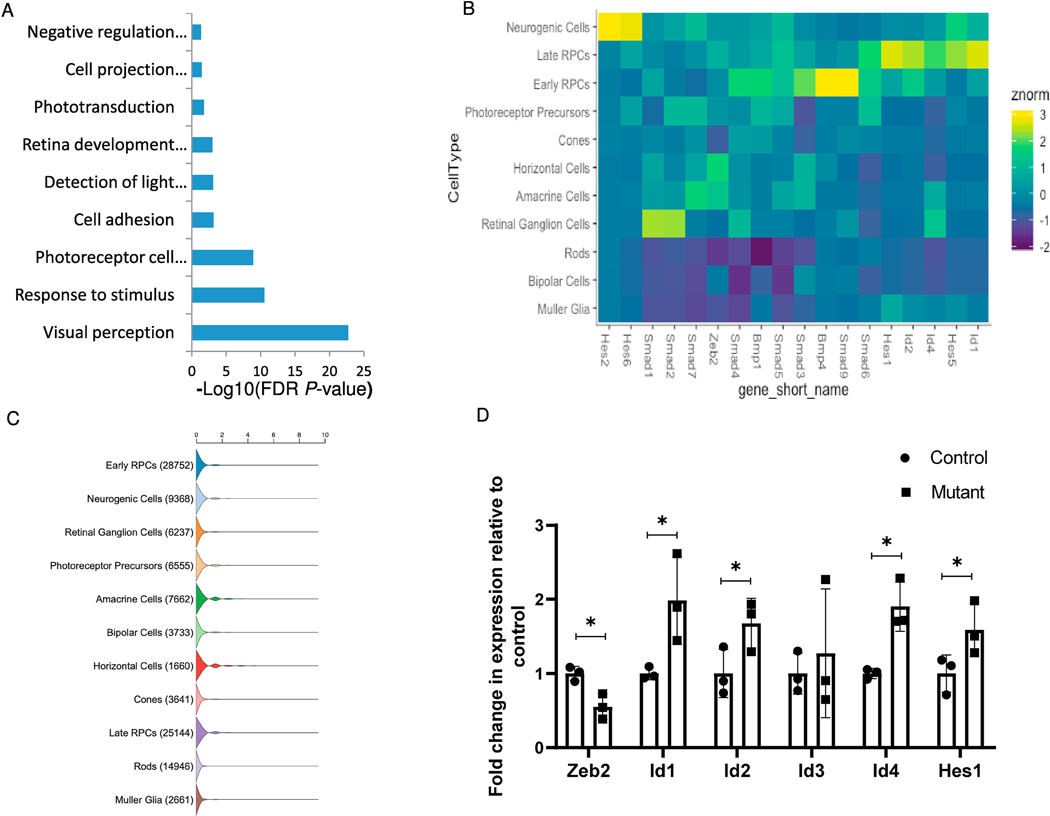
Fig. 2.
Transcriptomic analysis of control and Zeb2loxp/loxp;αCre retinas during early postnatal development reveals upregulation of BMP and Notch target genes. (A) Significantly enriched functional categories in the list of genes upregulated in Zeb2loxp/loxp;αCre retinas according to DAVID gene-ontology analysis. (B) Heatmap representing normalized enrichment of select genes across individual retinal cell types as annotated through single-cell RNA-Seq. Individual genes shown represent upregulated transcripts in the Zeb2loxp/loxp;αCre retinas from the RNA-Seq data. (C) Violin plot representation of the number of transcripts of Zeb2 in developing and mature retinal cell types based on single-cell analyses (Clark et al., 2019).(D) Relative quantification of the transcript levels of Zeb2, Id1, Id2, Id3, Id4 and Hes1 by realtime PCR analysis (P = 0.008 for Zeb2, 0.022 for Id1, 0.033 for Id2, 0.31 for Id3, 0.004 for Id4, 0.039 for Hes1, N = 3, one-tailed Student’s t-test). *P < 0.05.

