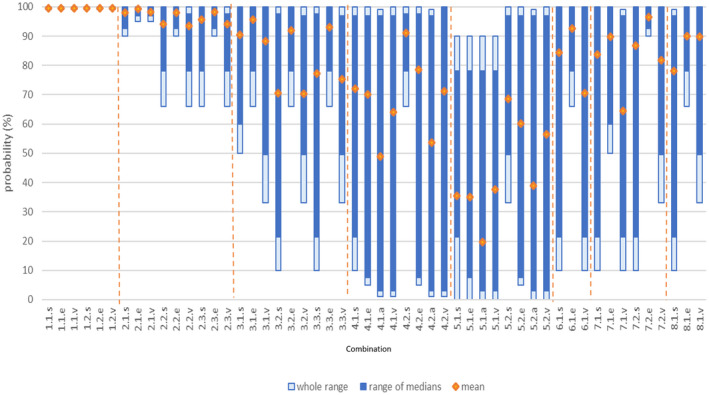
Figure C.1.

- Combinations are indicated as material number.Process number.Indicator (s: S. senftenberg; e: E. faecalis; a: eggs of Ascaris sp; v: virus). The bars indicate the whole range of elicited probabilities (lowest lower value of the ranges to highest upper value of the ranges) and the range of the medians of the ranges provided by the experts. The dots show the mean of the median estimates provided by the experts.
