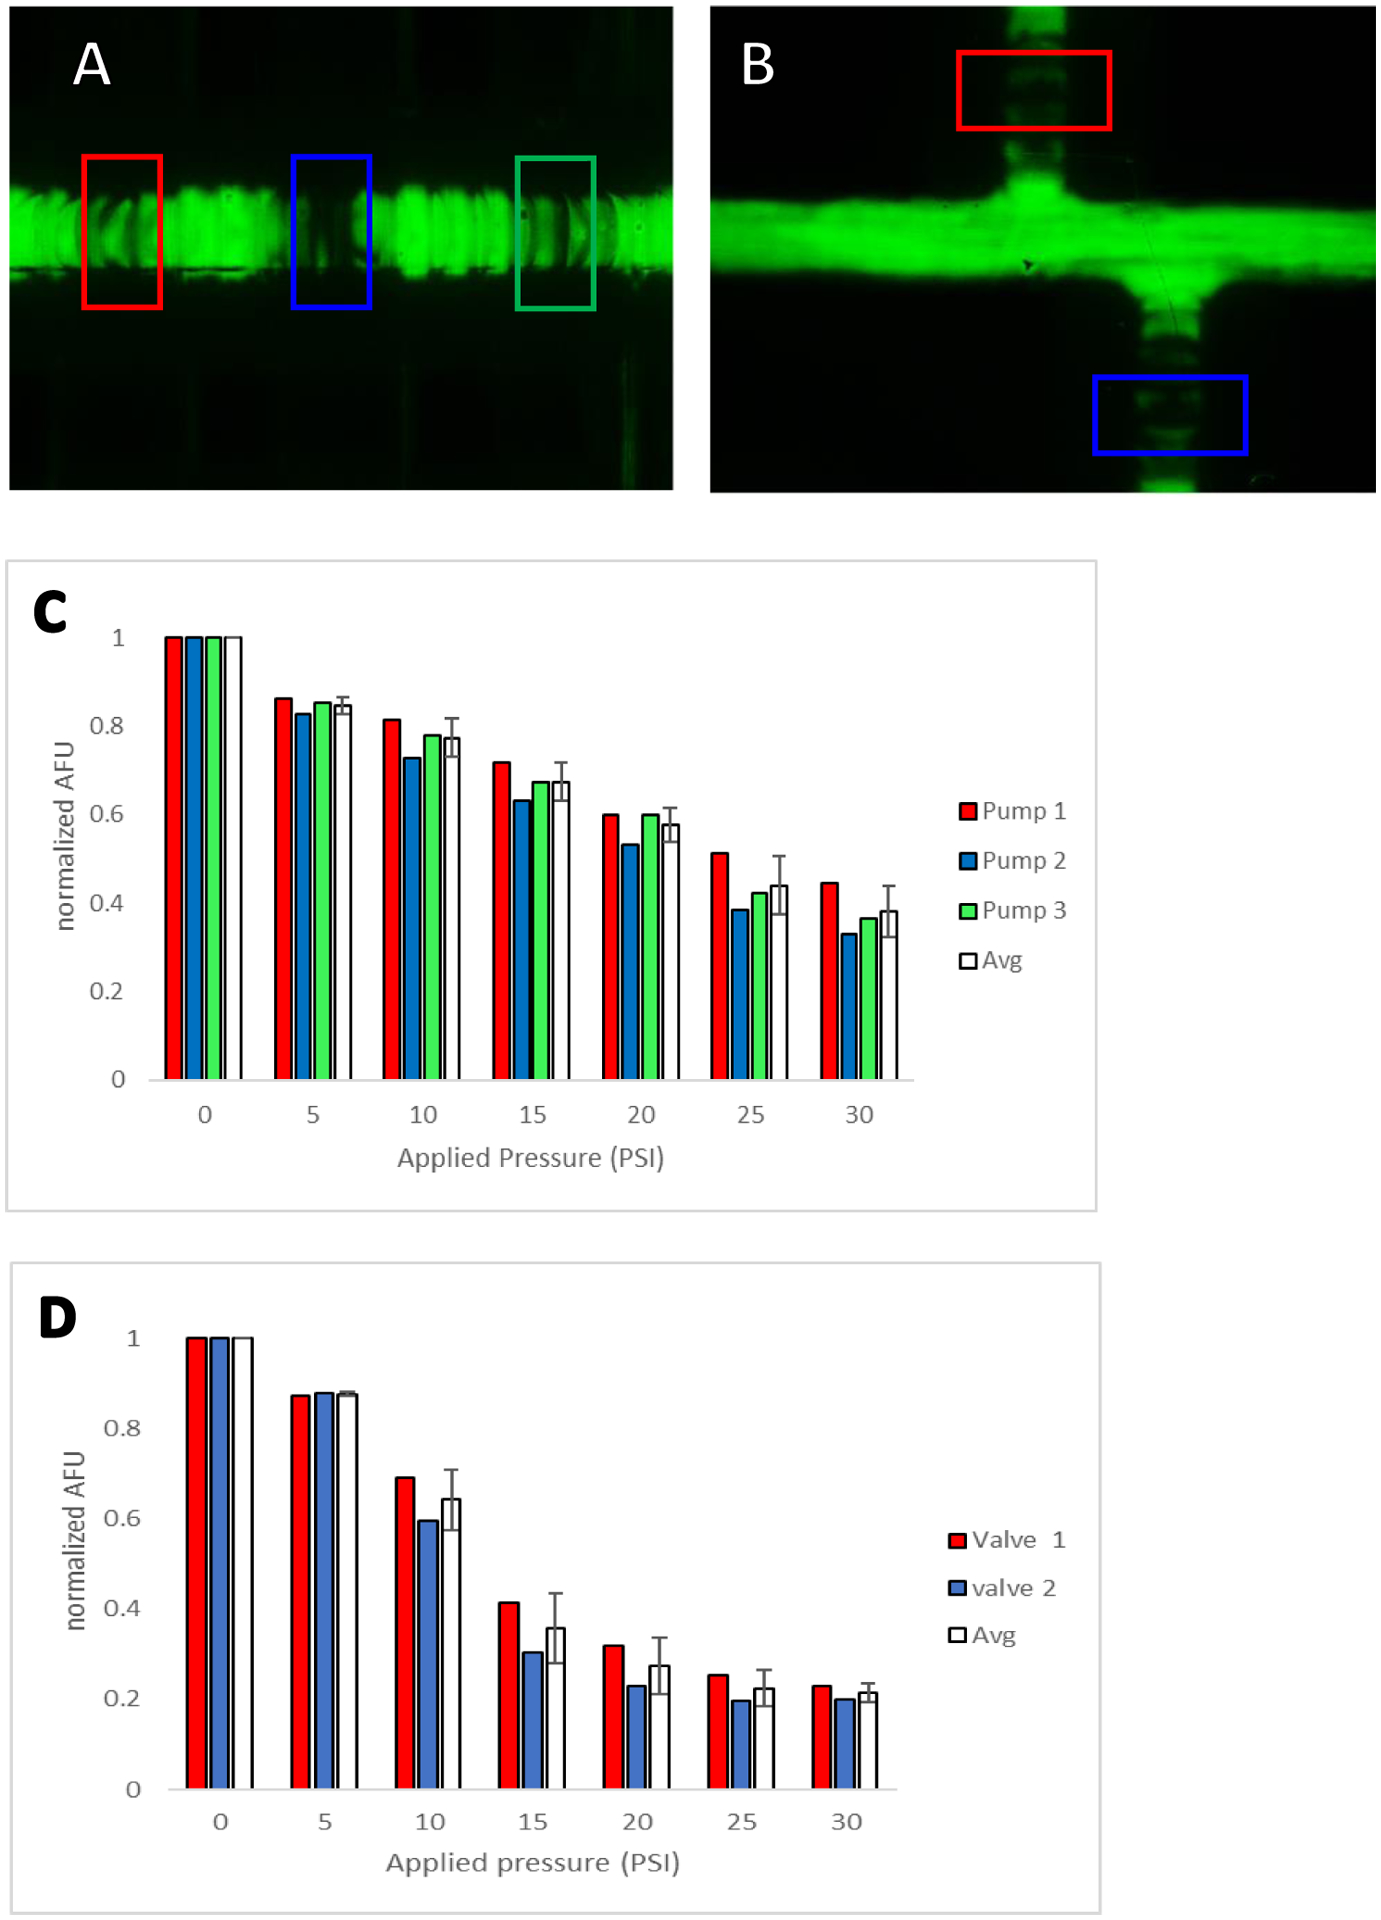
Figure 4.

Fluorescence characterization of closing the pumps/valves. (A) Pumping valves with regions of analysis (detection windows) denoted in red, blue, and green. (B) Injection valves with regions of analysis (detection window) denoted in red and blue. (C) Plot of relative fluorescence intensity for each pump valve vs. increased applied pressure. Average normalized fluorescence for the all 3 pumping valves are shown in white. (D) Plot of relative fluorescence intensity for both injection valves vs. increased applied pressure. Average normalized fluorescence for the valves shown in white.
